Build Your First Dashboard
You're ready to start building! Let’s walk through creating a basic dashboard in Embeddable - from adding your first component to embedding the result.
Create a New Embeddable
- On your workspace homepage, click Create new Embeddable to create a fresh dashboard.
Add a Text Component
- Click Add component (top right).
- Scroll down and choose Text component.
- Fill in Title and Body, then hit Save.
💡
The available components come from your code repository.
Add a Dataset
- In the Datasets panel (bottom right), click the + icon.
- Name your dataset, select My customers (or any other sample data model), then Save.
Add a Pie Chart
- Click Add component again. Pick Pie Chart.
- In the edit panel, set Dataset to display to the dataset you just created.
- Select your preferred Slice and Metric.
- Save and position your pie chart on the canvas.
Add Interactivity
Let's add a search input that filters the data. Watch and follow this quick video:
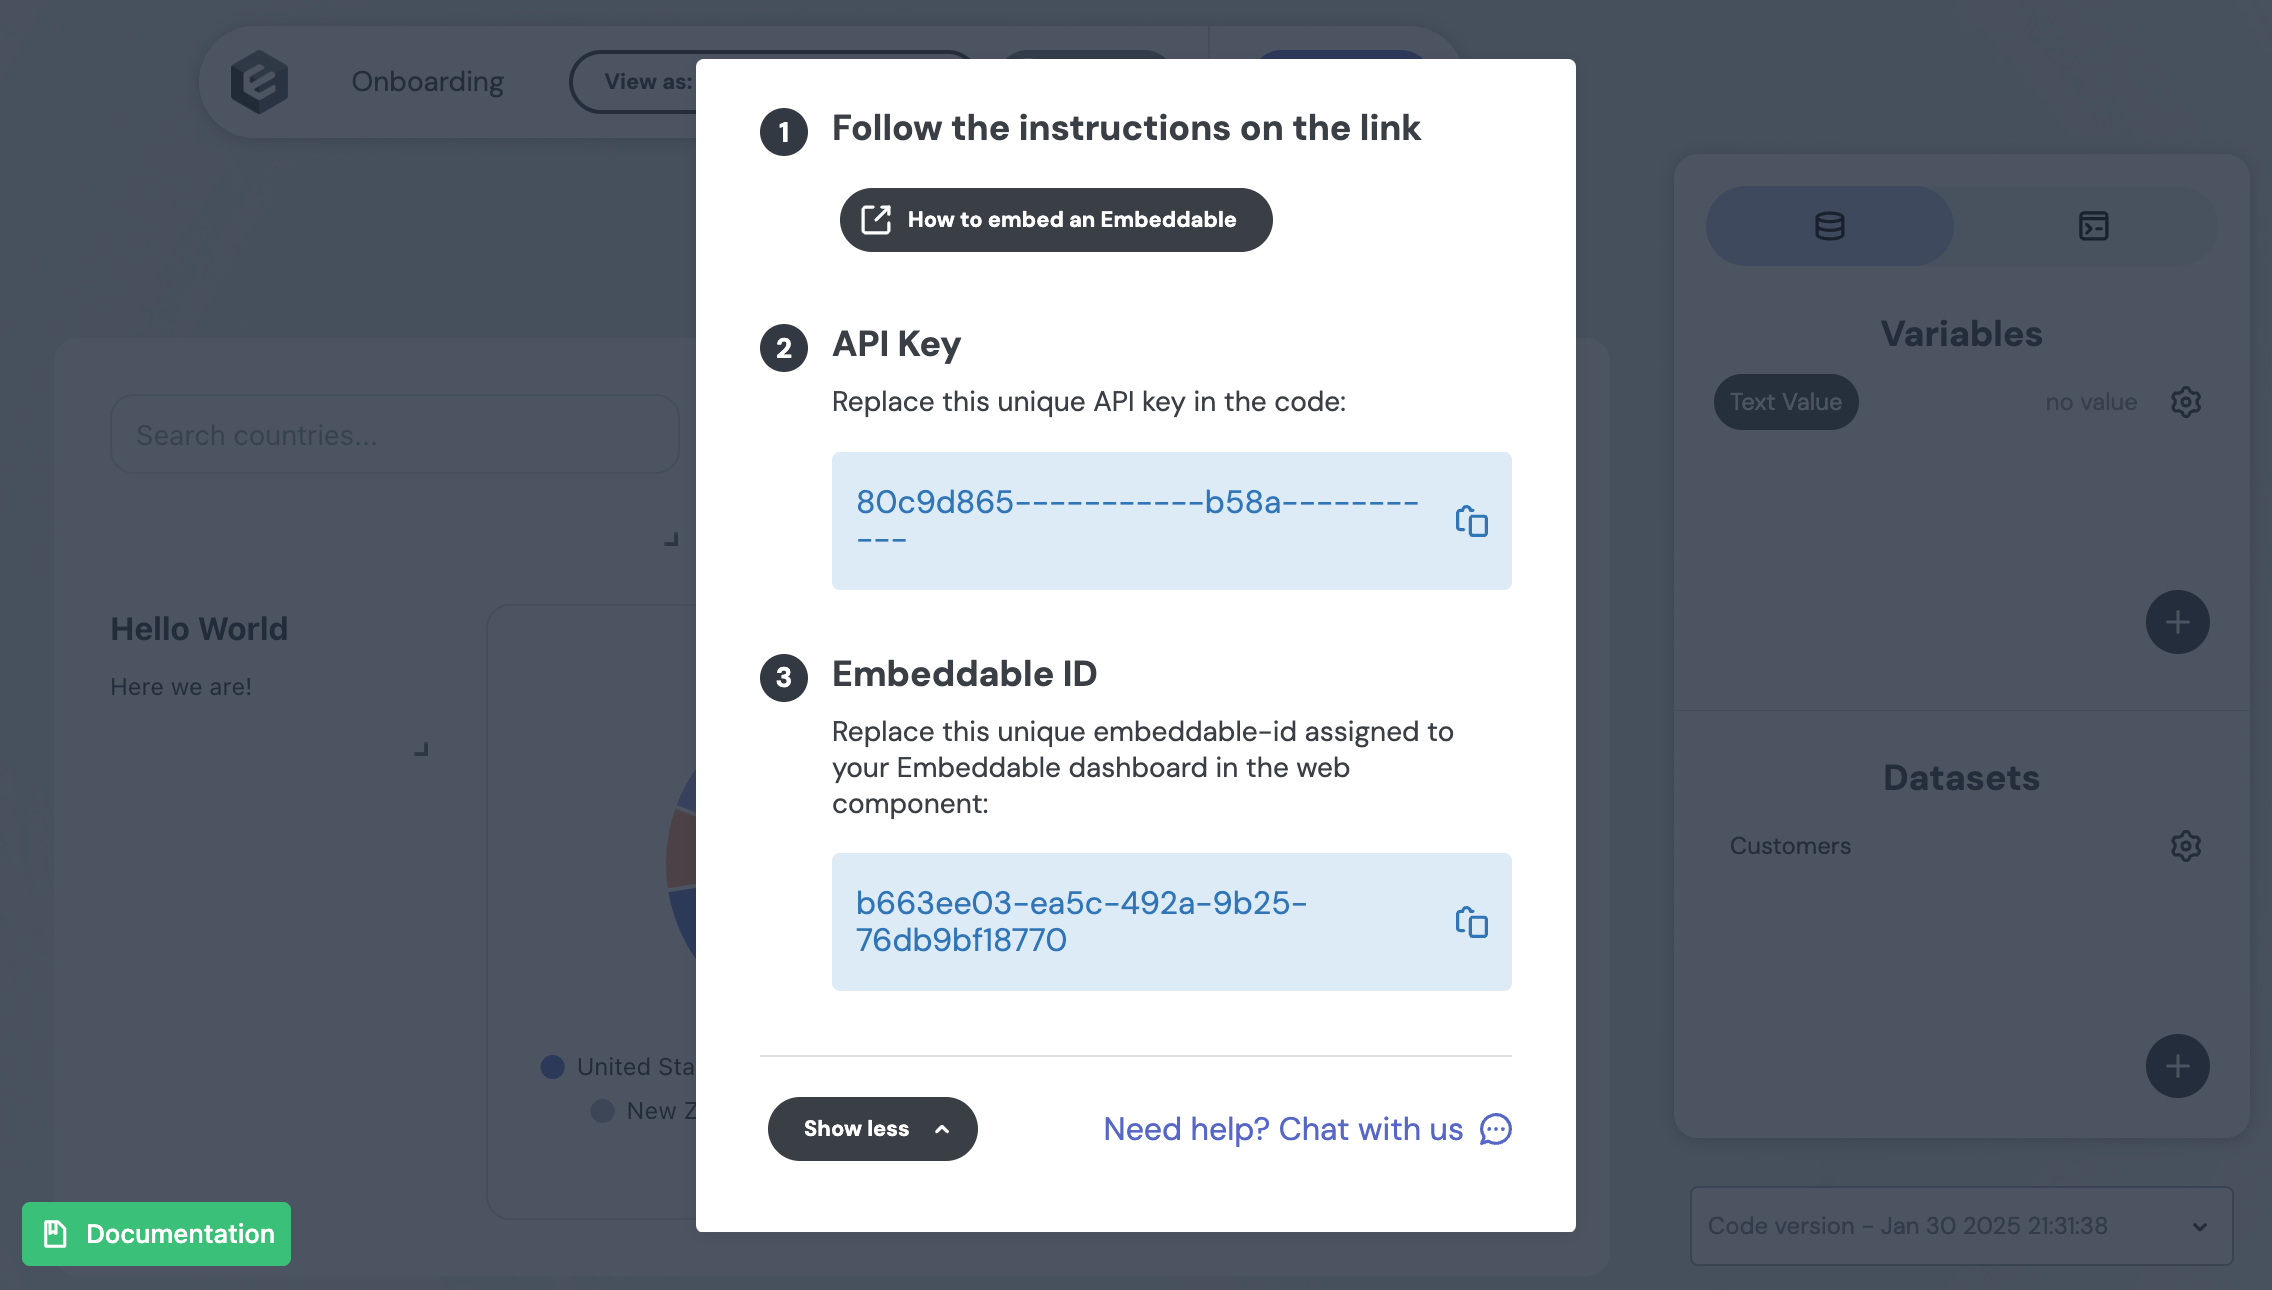
Embed Your Dashboard
- Click Publish at the top of your dashboard.
- In the pop-up, copy your API Key and Embeddable ID.
- In your code repo, open
embedding-preview.cjs(insidescripts). - Update the
BASE_URL,API_KEY, andEMBEDDABLE_IDwith the values from your dashboard. - Run:
node src/embeddable.com/scripts/embedding-preview.cjs - Go to http://localhost:8080/ (opens in a new tab) to see your embedded dashboard in action!
Next Steps
- Try More Components: Explore different charts, text blocks, or interactive controls.
- Connect your data: Securely connect your database.