Introduction to Dashboards
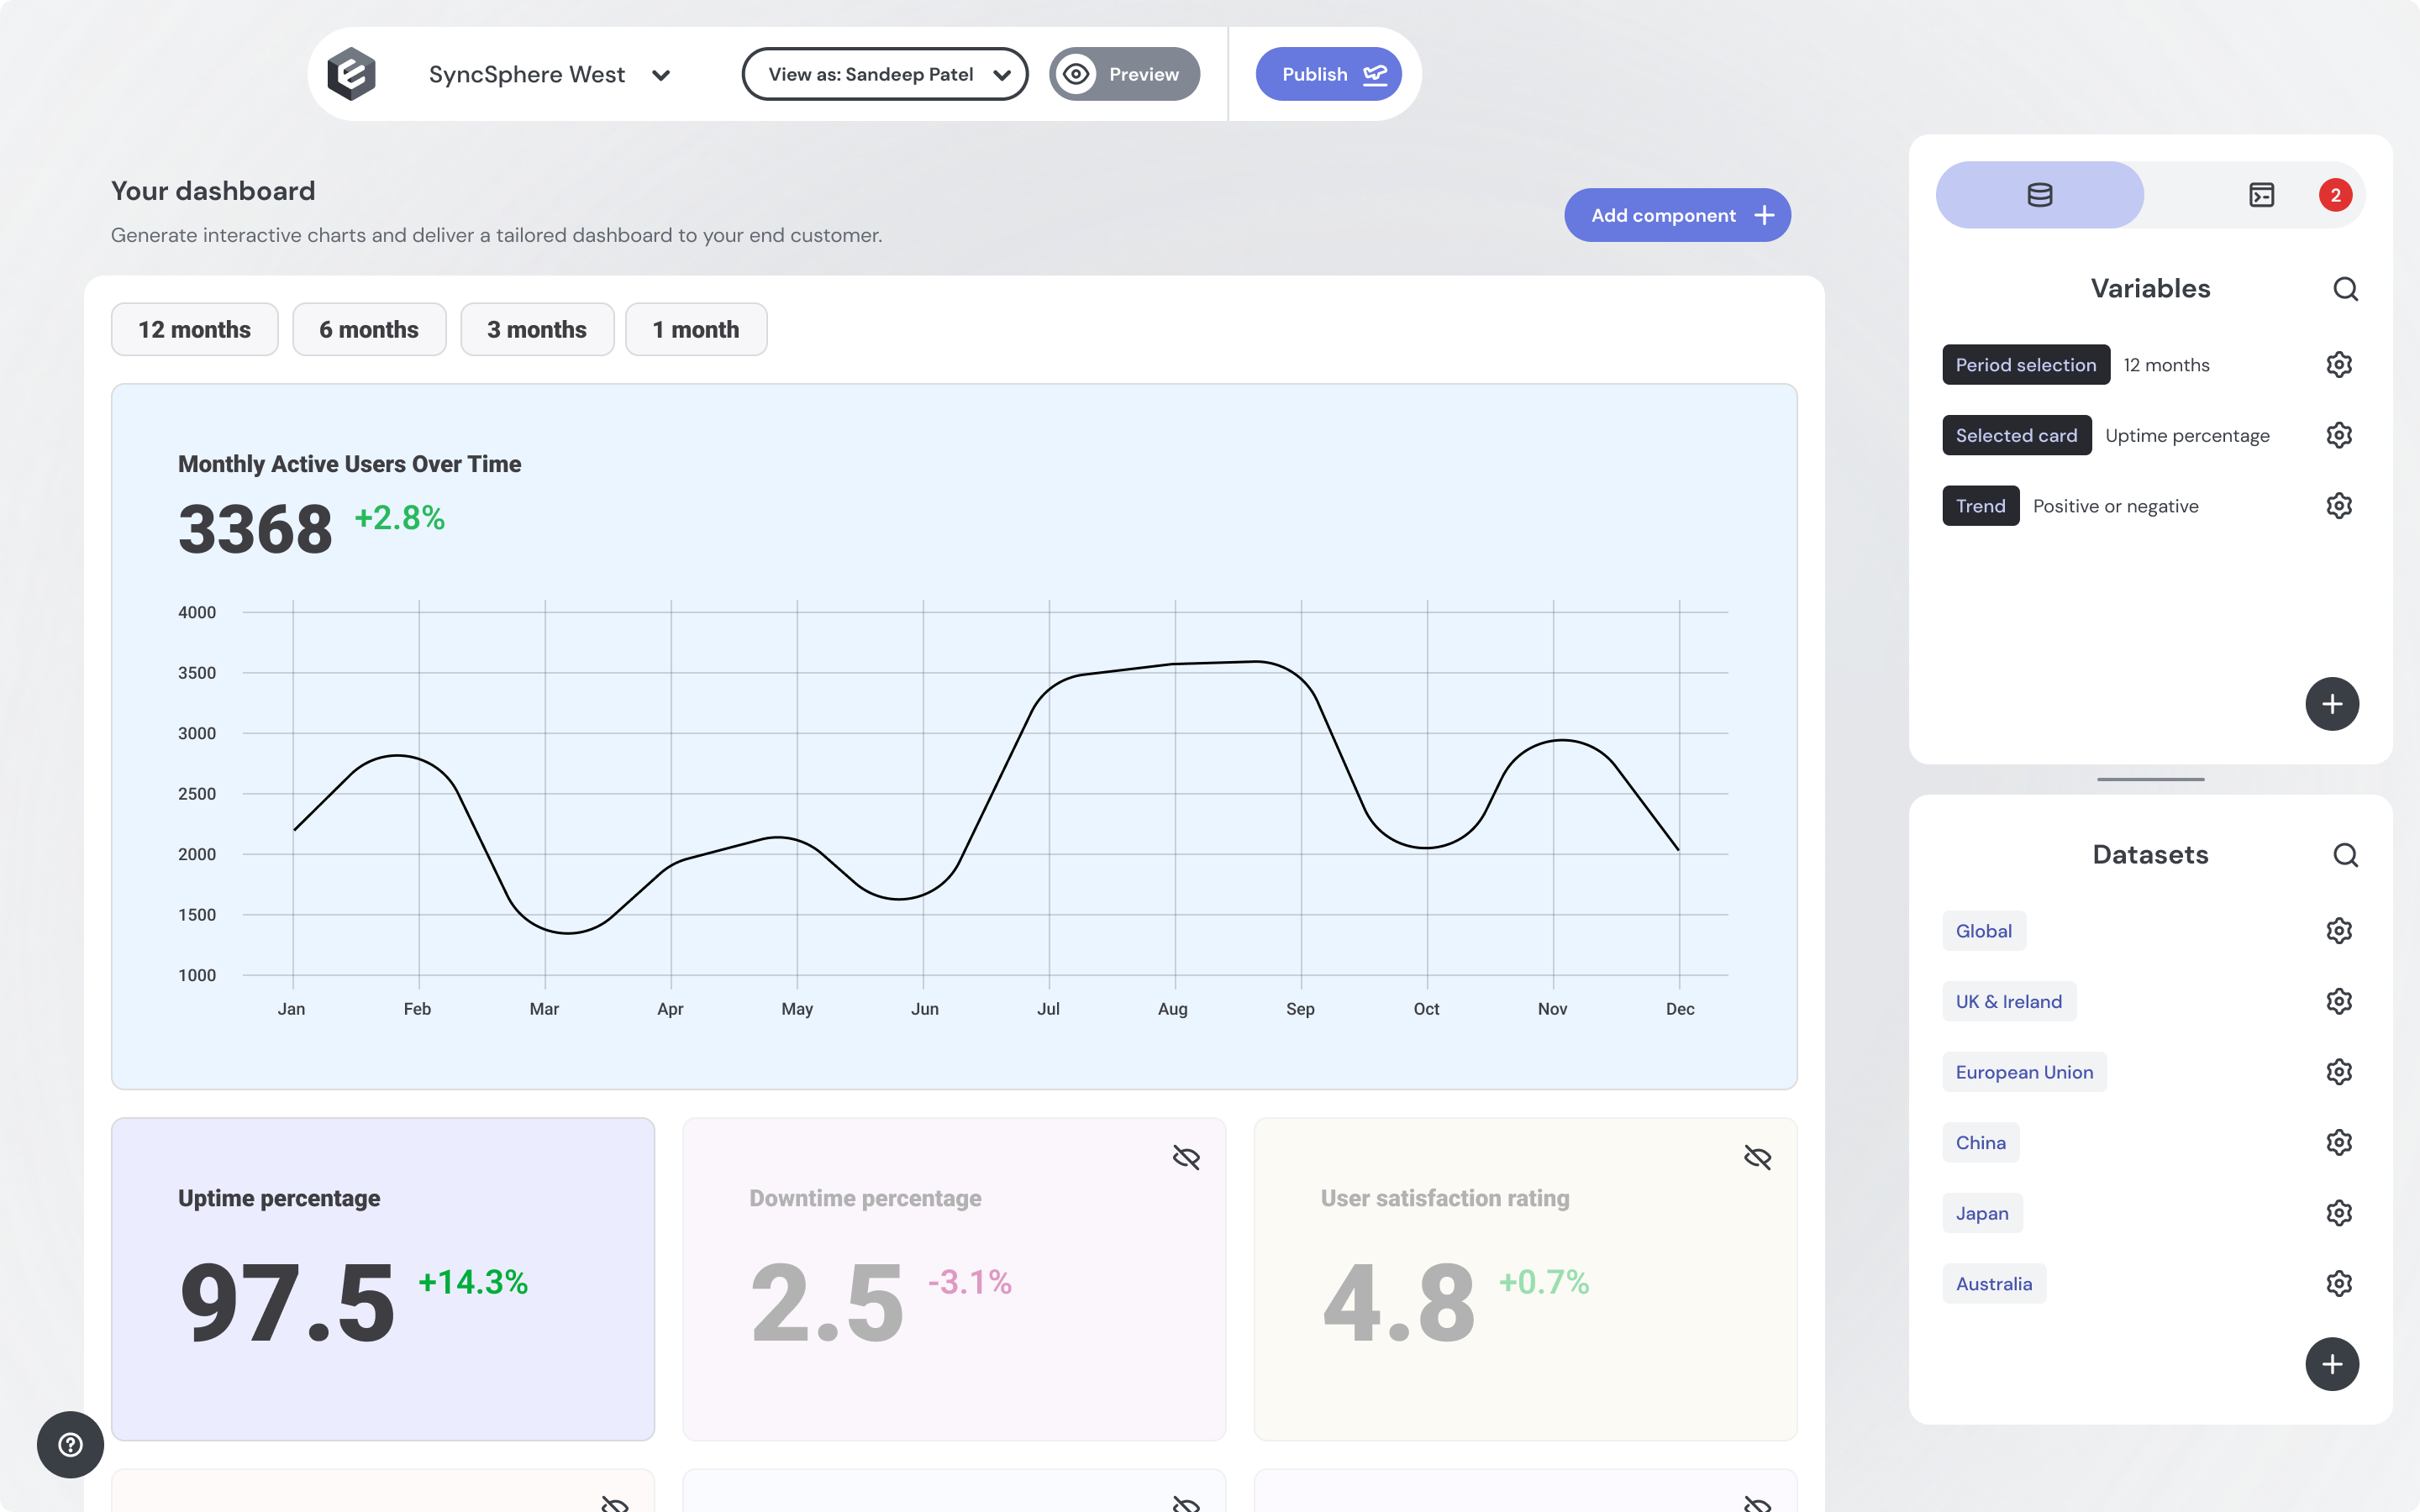
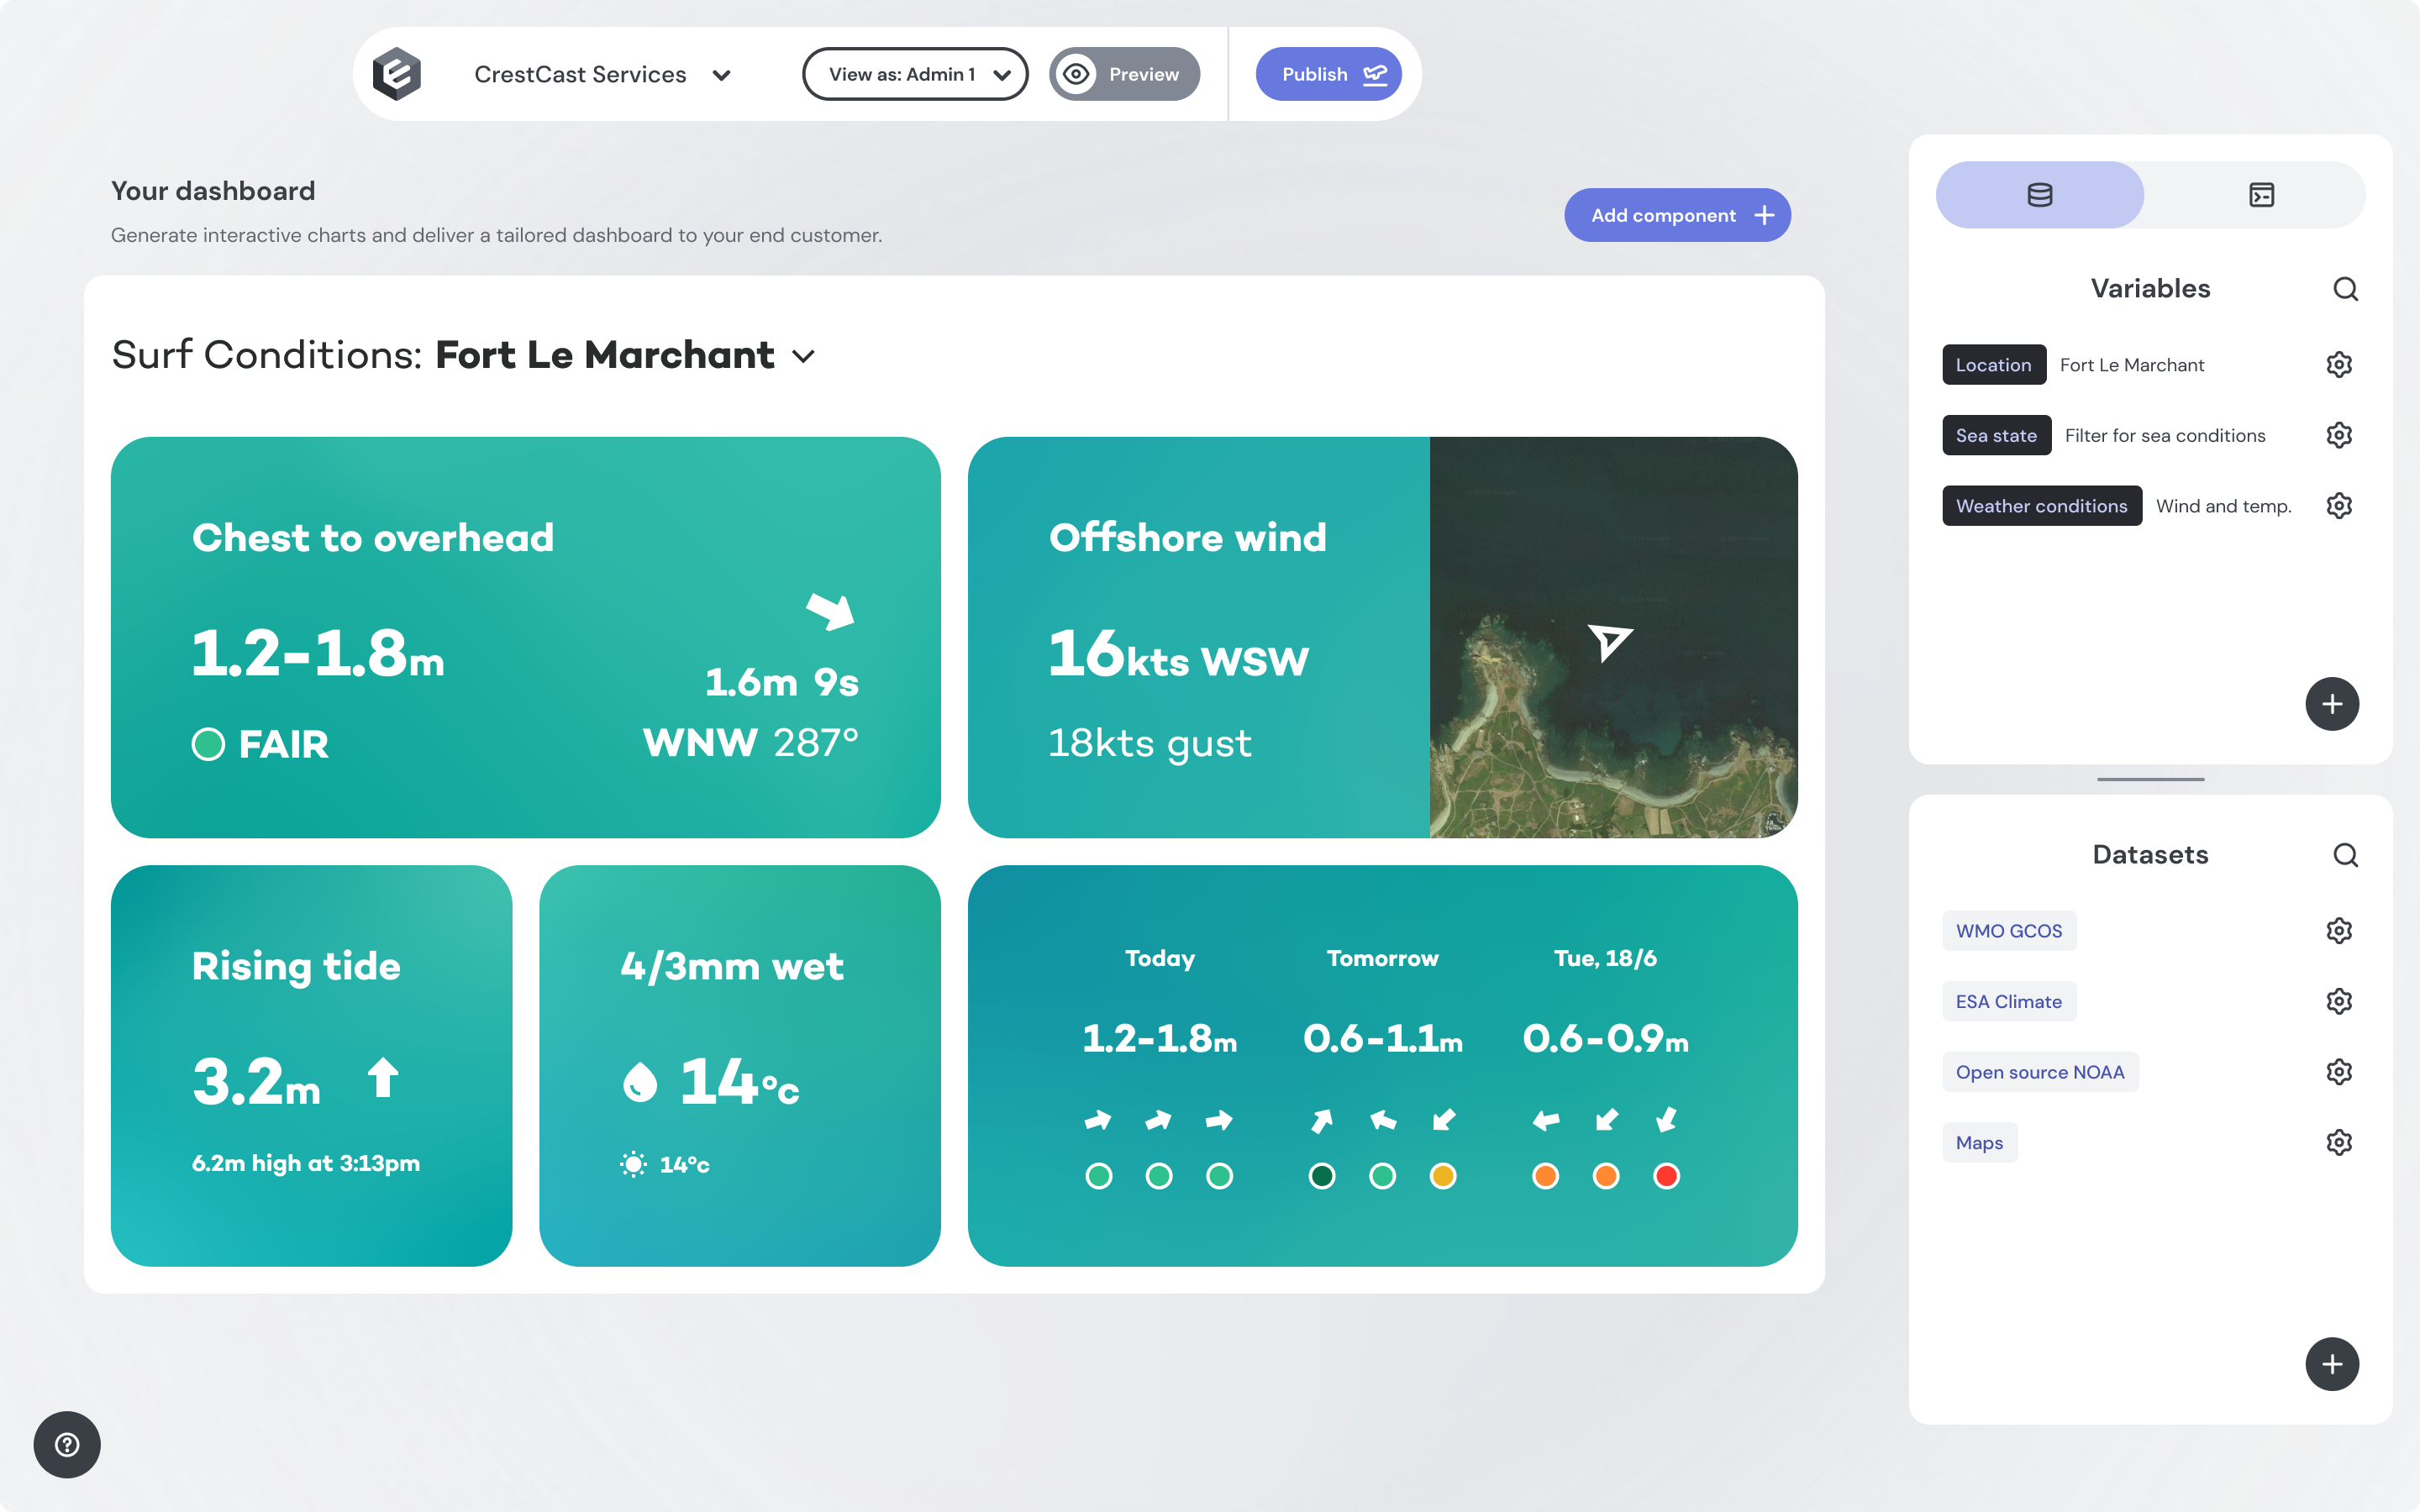
An Embeddable dashboard brings together your data models (defined in code) and components (written in React) into an interactive analytics experience you embed in your app. Every dashboard is assembled from the same building blocks — however you build it.
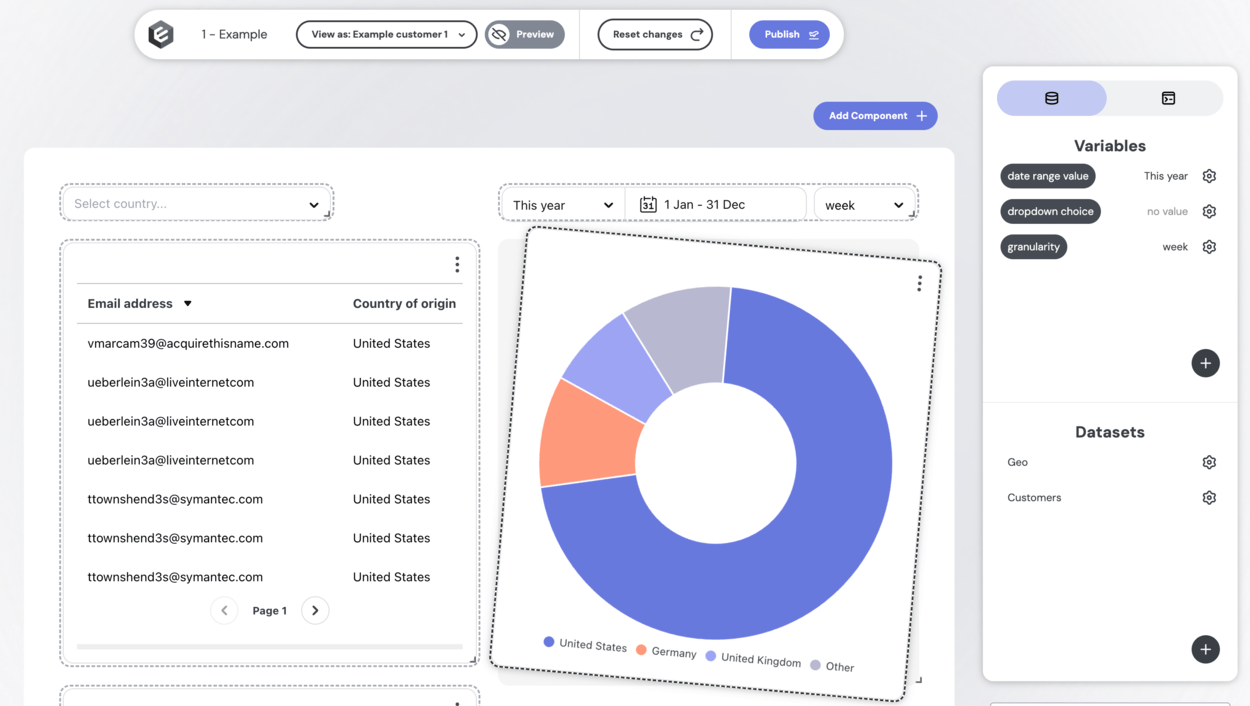
The building blocks
A dashboard is assembled from four building blocks, arranged on a grid. They're the same whether you build in the no-code builder or in code — in YAML they're literally the keys datasets, widgets, variables, and customCanvas.
Datasets
A dataset is a named data model with optional filters applied — the data a component shows. For example, a Customers dataset based on your customers model, and a High-Spend Customers dataset that filters it.
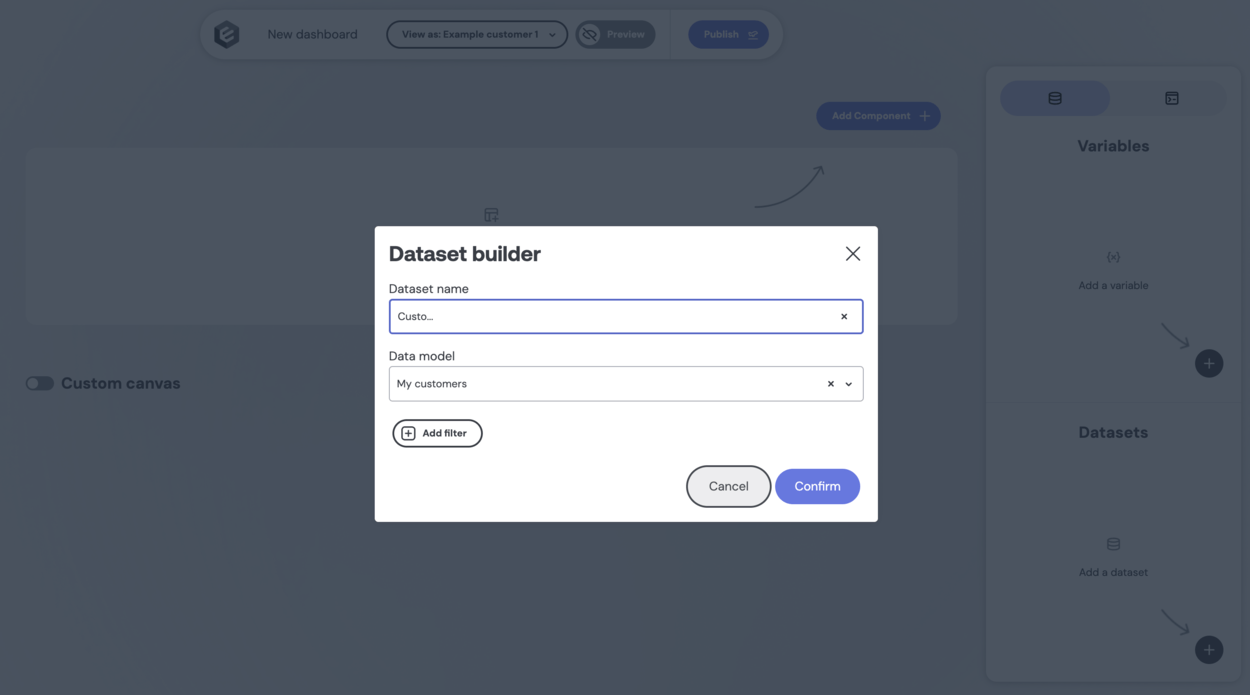
Because data models include row-level security rules and transformations, everyone sees the right data automatically — it isn't something you need to think about when building a dashboard.
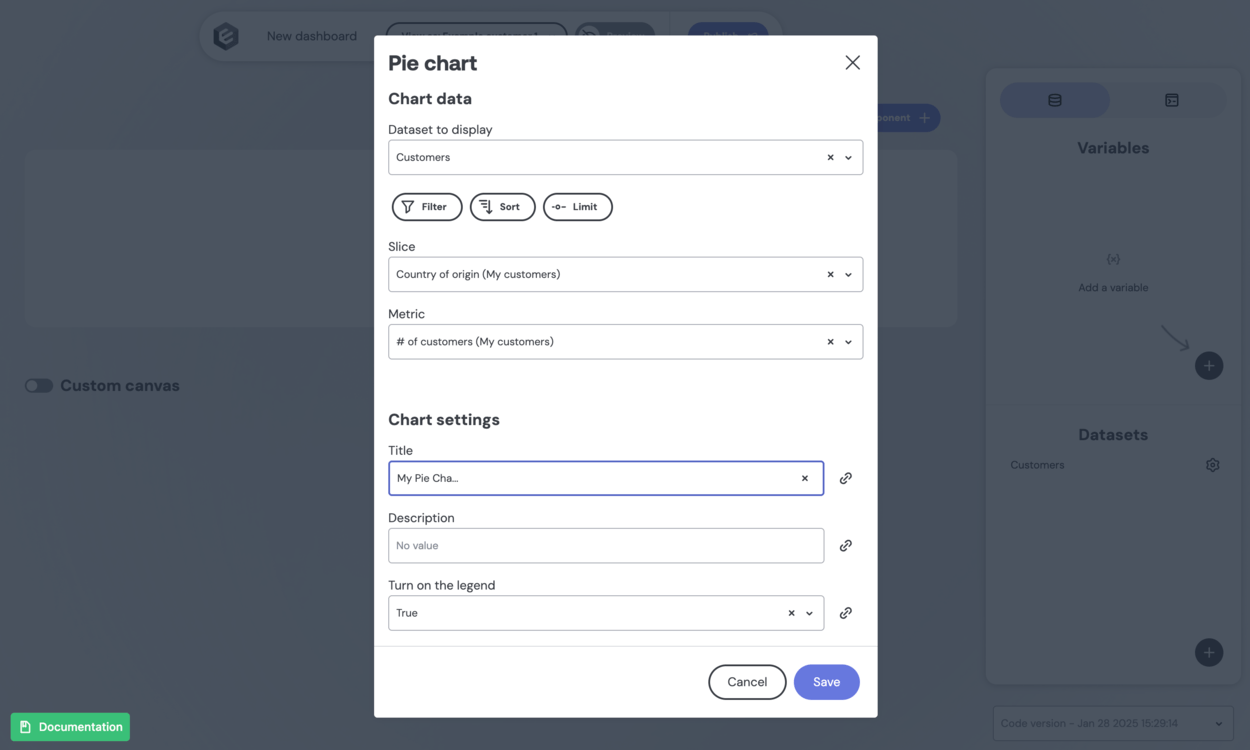
Components
Components are the visual and interactive elements — charts, tables, dropdowns, text blocks. Your dev team builds and pushes them, and each exposes inputs you fill in (e.g. which dimension goes on the x-axis, or the title). In code, components are called widgets.
Variables
Variables are reactive values that make a dashboard interactive. A filter, search box, or picker updates a variable, and every component or dataset bound to it reacts in real time.
Custom Canvas
Optionally, a dashboard can include a Custom Canvas — an area your end-users can build on themselves, from templates you define.
Layout
Components sit on a 12-column grid that reflows responsively — 12 columns on desktop, 1 on mobile. In the builder you drag and resize them; in code you set each widget's position and dimensions.
Two ways to build
You assemble those building blocks in one of two ways — both produce the same dashboard, in the same workspace:
- No-code builder — arrange the blocks visually, by drag-and-drop. Ideal for non-technical users like product managers, analysts, or support teams.
- Dashboards as Code — define the same blocks in YAML inside your repo, for version control and a git-native workflow. You can even build them with AI.
These aren't separate worlds. The no-code builder is also where you preview and verify code dashboards while developing, and you can move between the two freely — convert a no-code dashboard to code, or edit a coded one visually in the local builder and sync it back to the file.
Follow a walkthrough to create your first dashboard→
Add interactivity
Make dashboards dynamic and explorable for your viewers:
- Interactivity with variables — wire up filters, search inputs, and pickers that update components in real time.
- Drill-down — let users click a data point to open a filtered detail view.
Save, publish & embed
- Save versions of your dashboard as you work.
- Publish to an environment when you're ready.
- Embed using a web component (
<em-beddable>, not an iFrame) so the dashboard feels native — responsive, themed, and seamless inside your app.