Custom Canvas
Custom Canvas lets your users go beyond static dashboards and create their own dashboards directly inside your product. You define the datasets, chart templates, and rules. They create, customize and explore the data to assemble a self-serve custom canvas that fits their workflow, without ever leaving your application.
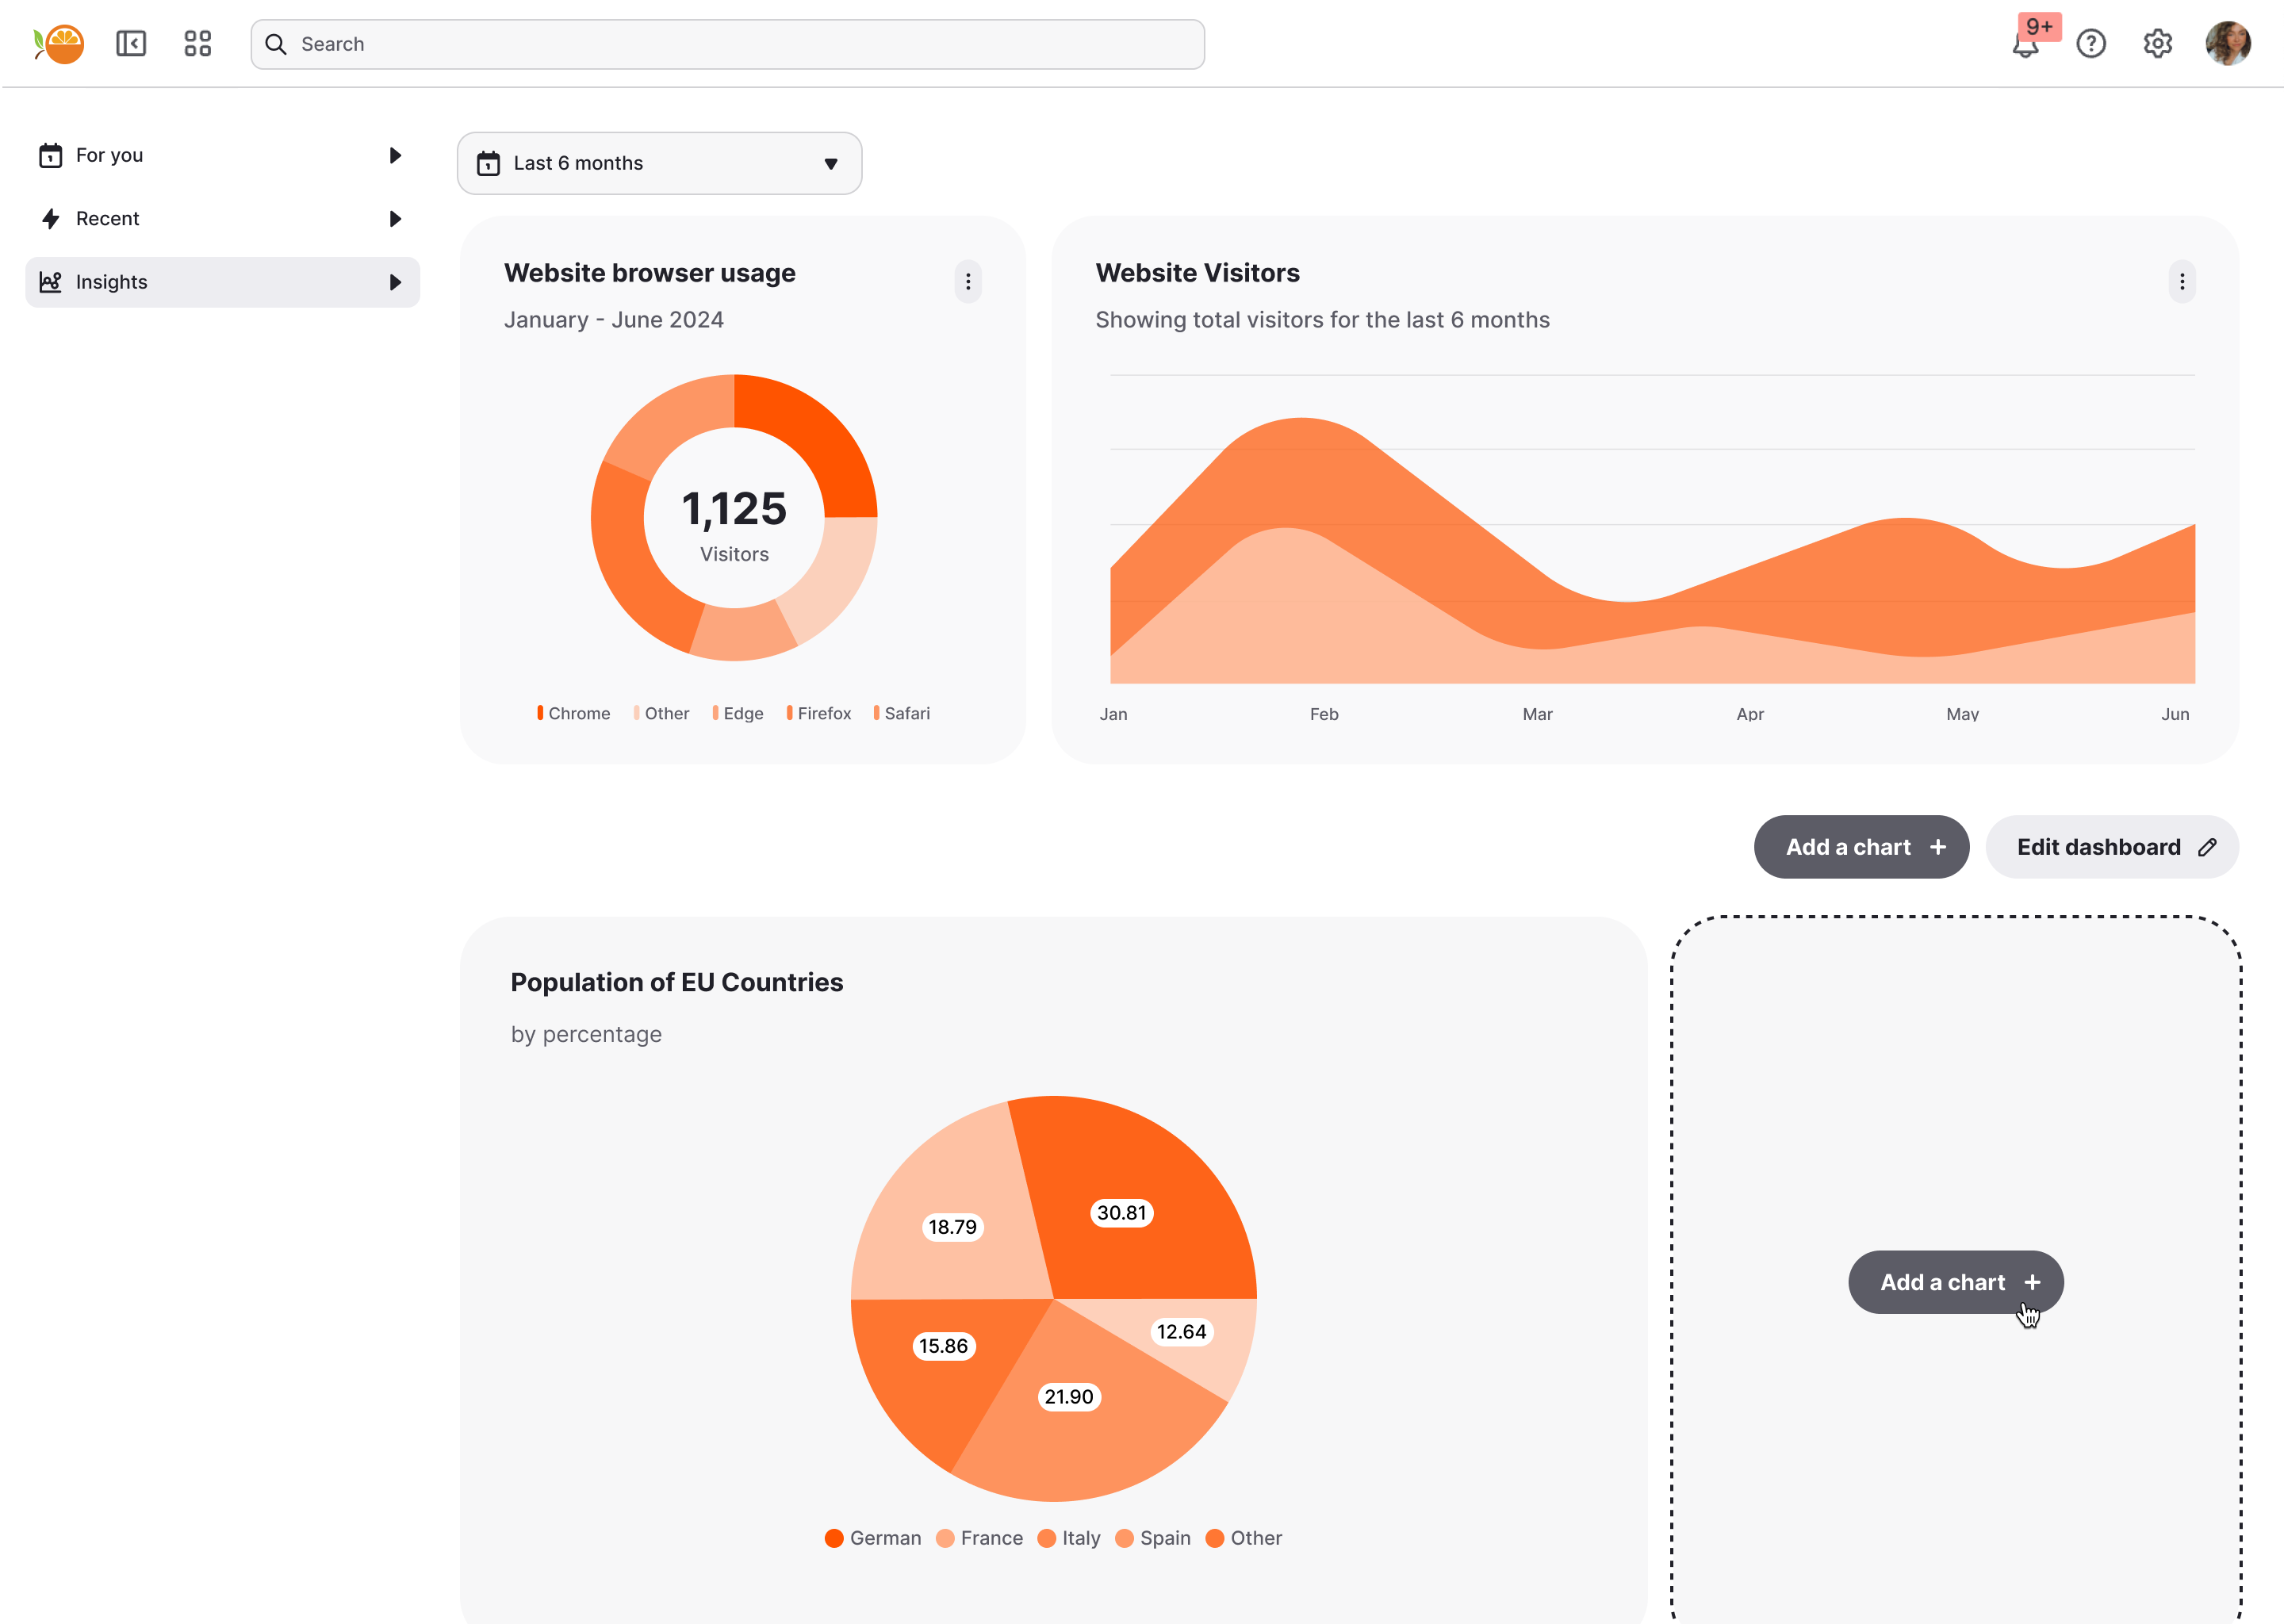
What can you build?
Common use cases of Custom Canvas include:
- Primary analytics dashboard that can be easily extended by your customers.
- “Create dashboard” button that allows customers to build and save as many dashboards in your platform as they like.
- Team dashboards, shared across multiple users, where some have edit permissions and others are just viewers.
This page will talk you through:
- What Custom Canvas looks like for your end-users.
- How to choose which datasets, dimensions and measures should be available to your end-users.
- How to choose (and customize) the charts, tables and components that your end-users can use to build their dashboards.
If you're looking, instead, for how to deploy Custom Canvas, or how to achieve the above 3 use-cases via deployment click here.
You can find a Live Demo of Custom Canvas in a React App here (opens in a new tab), and you can find the source code for the demo here (opens in a new tab).
The value for your end-users
With Custom Canvas, your users don’t just consume dashboards—they create dashboards that fit them.
-
Personalized insights, faster → Users build dashboards around the questions they care about, without waiting on engineering or analyst teams.
-
Freedom within guardrails → You define the datasets, metrics, and chart types, while they explore and customize with confidence.
-
Seamless, scalable experience → Dashboards live inside your app, feel native, and grow with users’ needs—from a quick chart to a full reporting hub.
By empowering your end-users to help themselves to exactly what they need, you’re saving your own teams the time and effort of continuously building custom reports.
Embeddable also handles the rest:
- Row-level security so that each end-user only sees the data they’re allowed to see (learn more).
- Theming, internationalisation and timezone support can be applied so it feels like a native part of your platform experience.
- The dashboard state for every custom dashboard is automatically stored and restored for your end-users when they make changes and later return, meaning “it just works” as soon as it's deployed (learn more).
The end-user experience
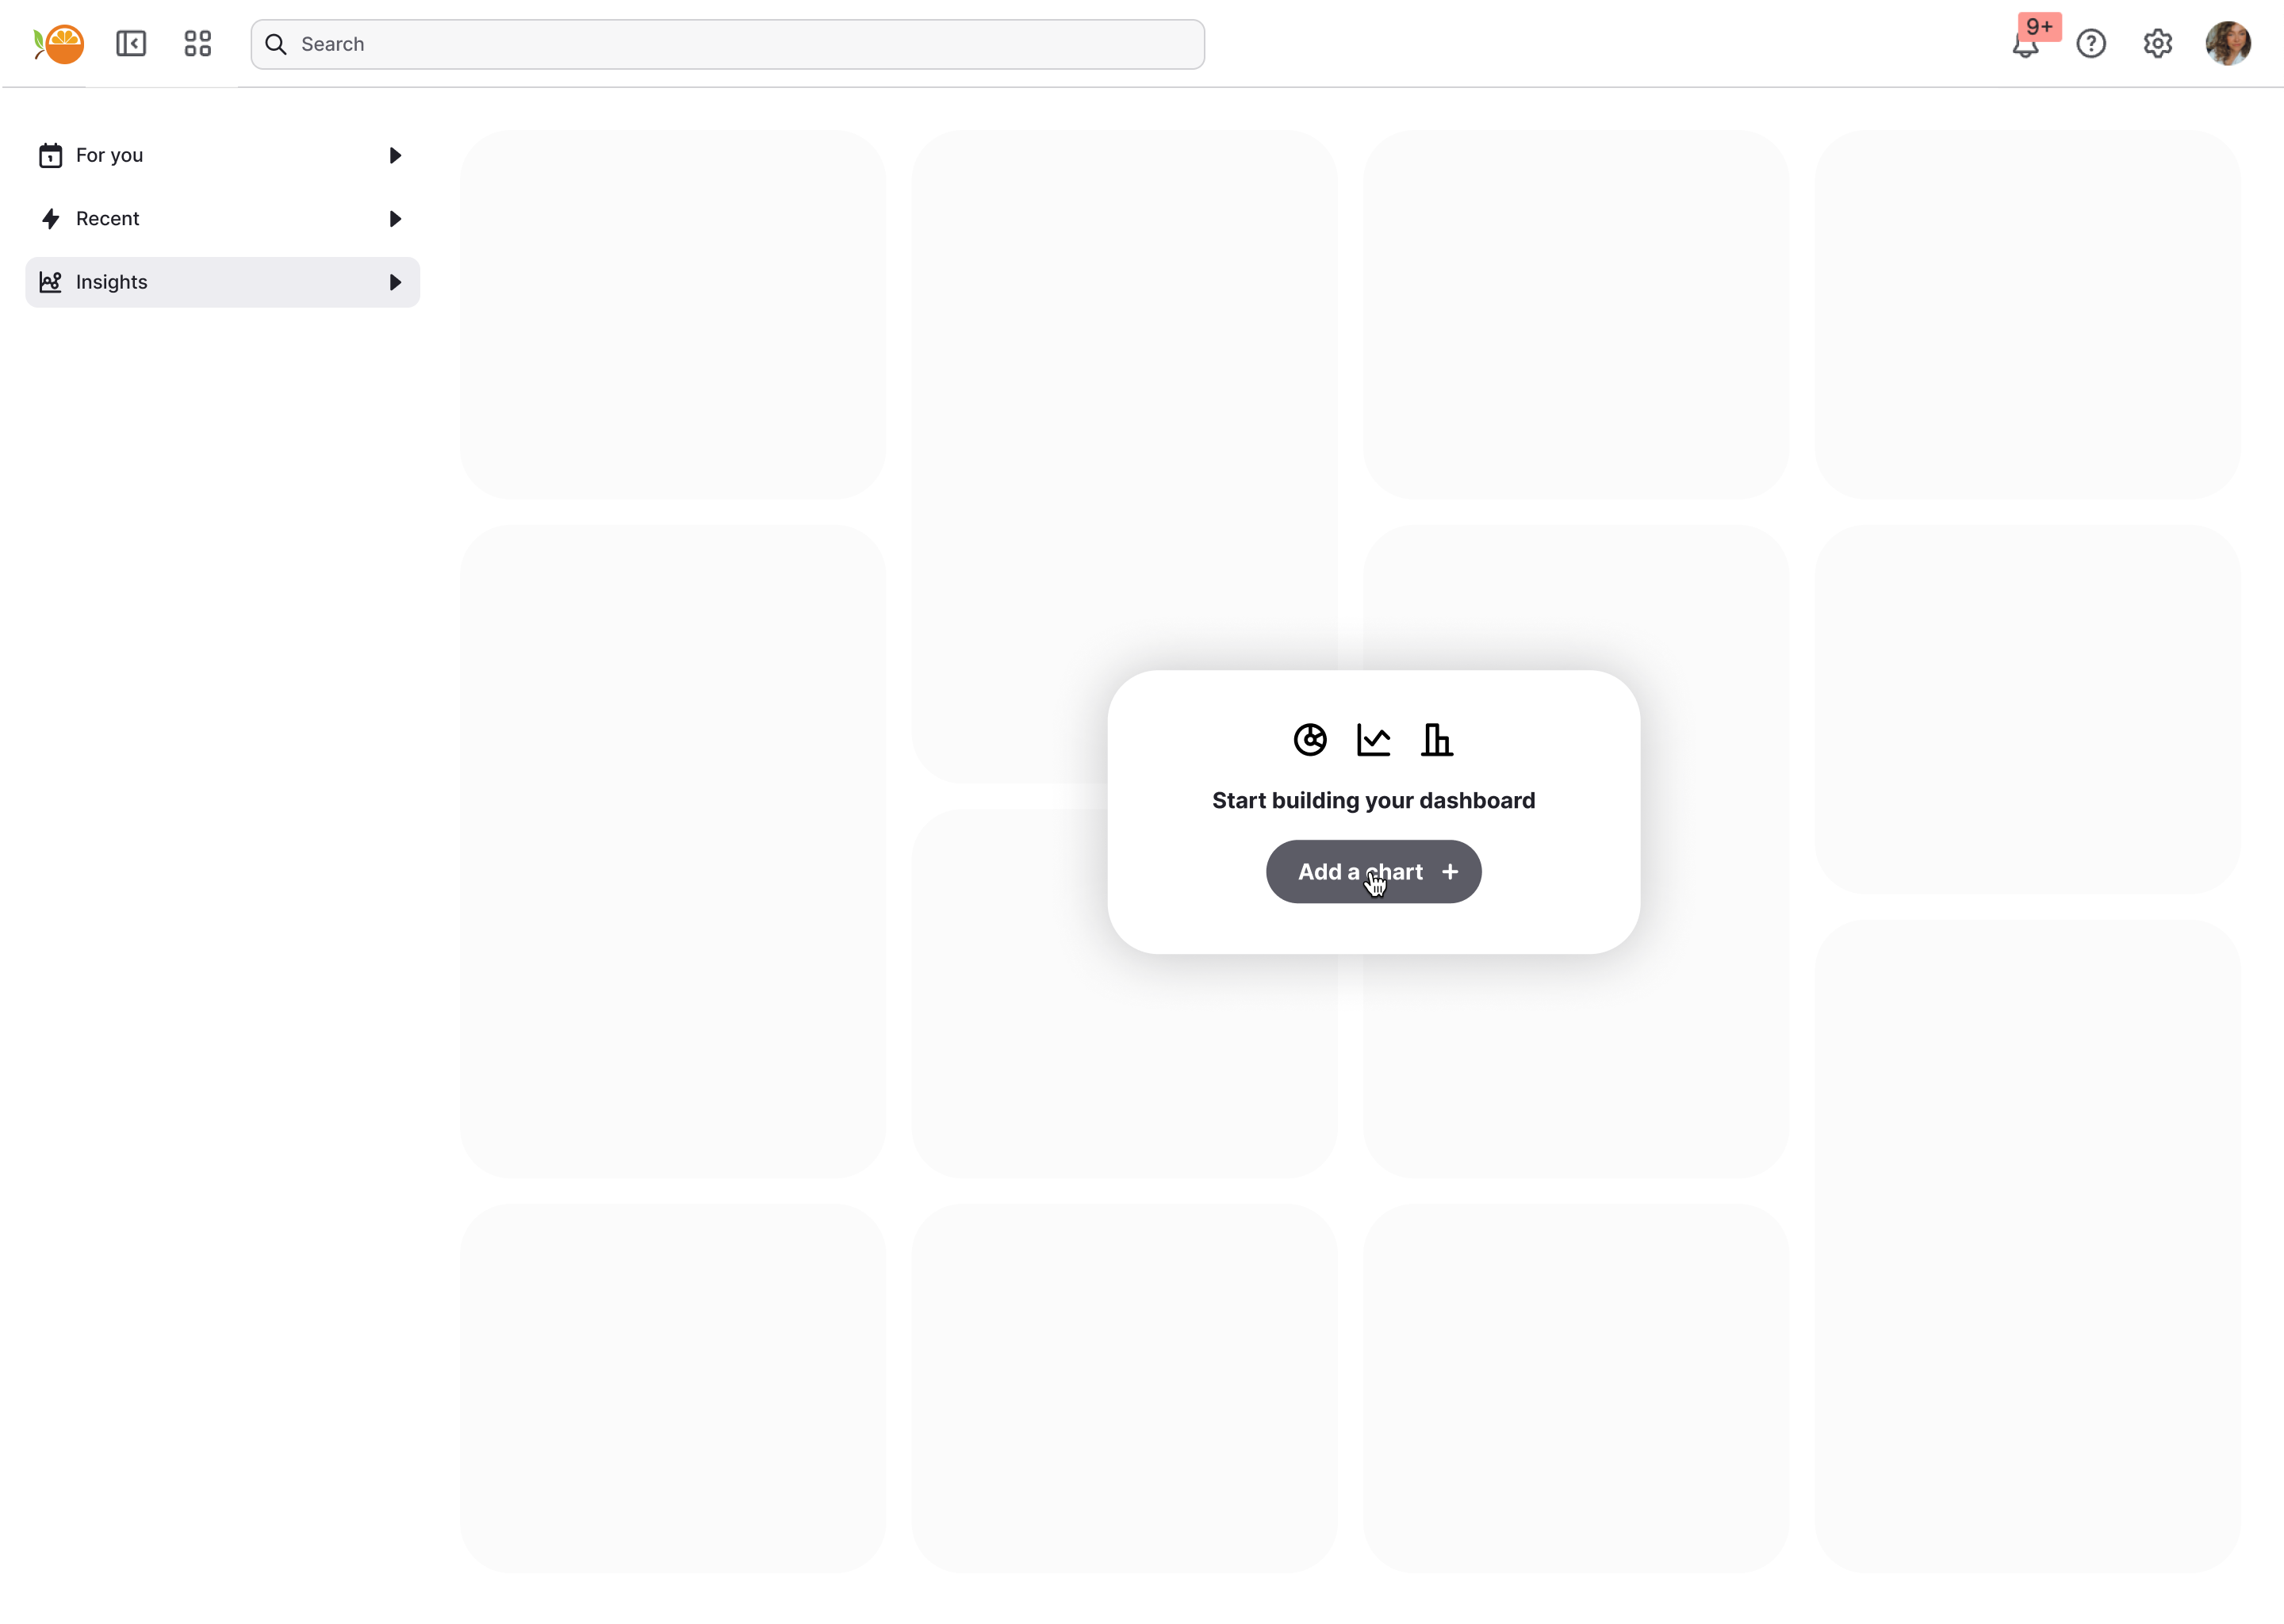
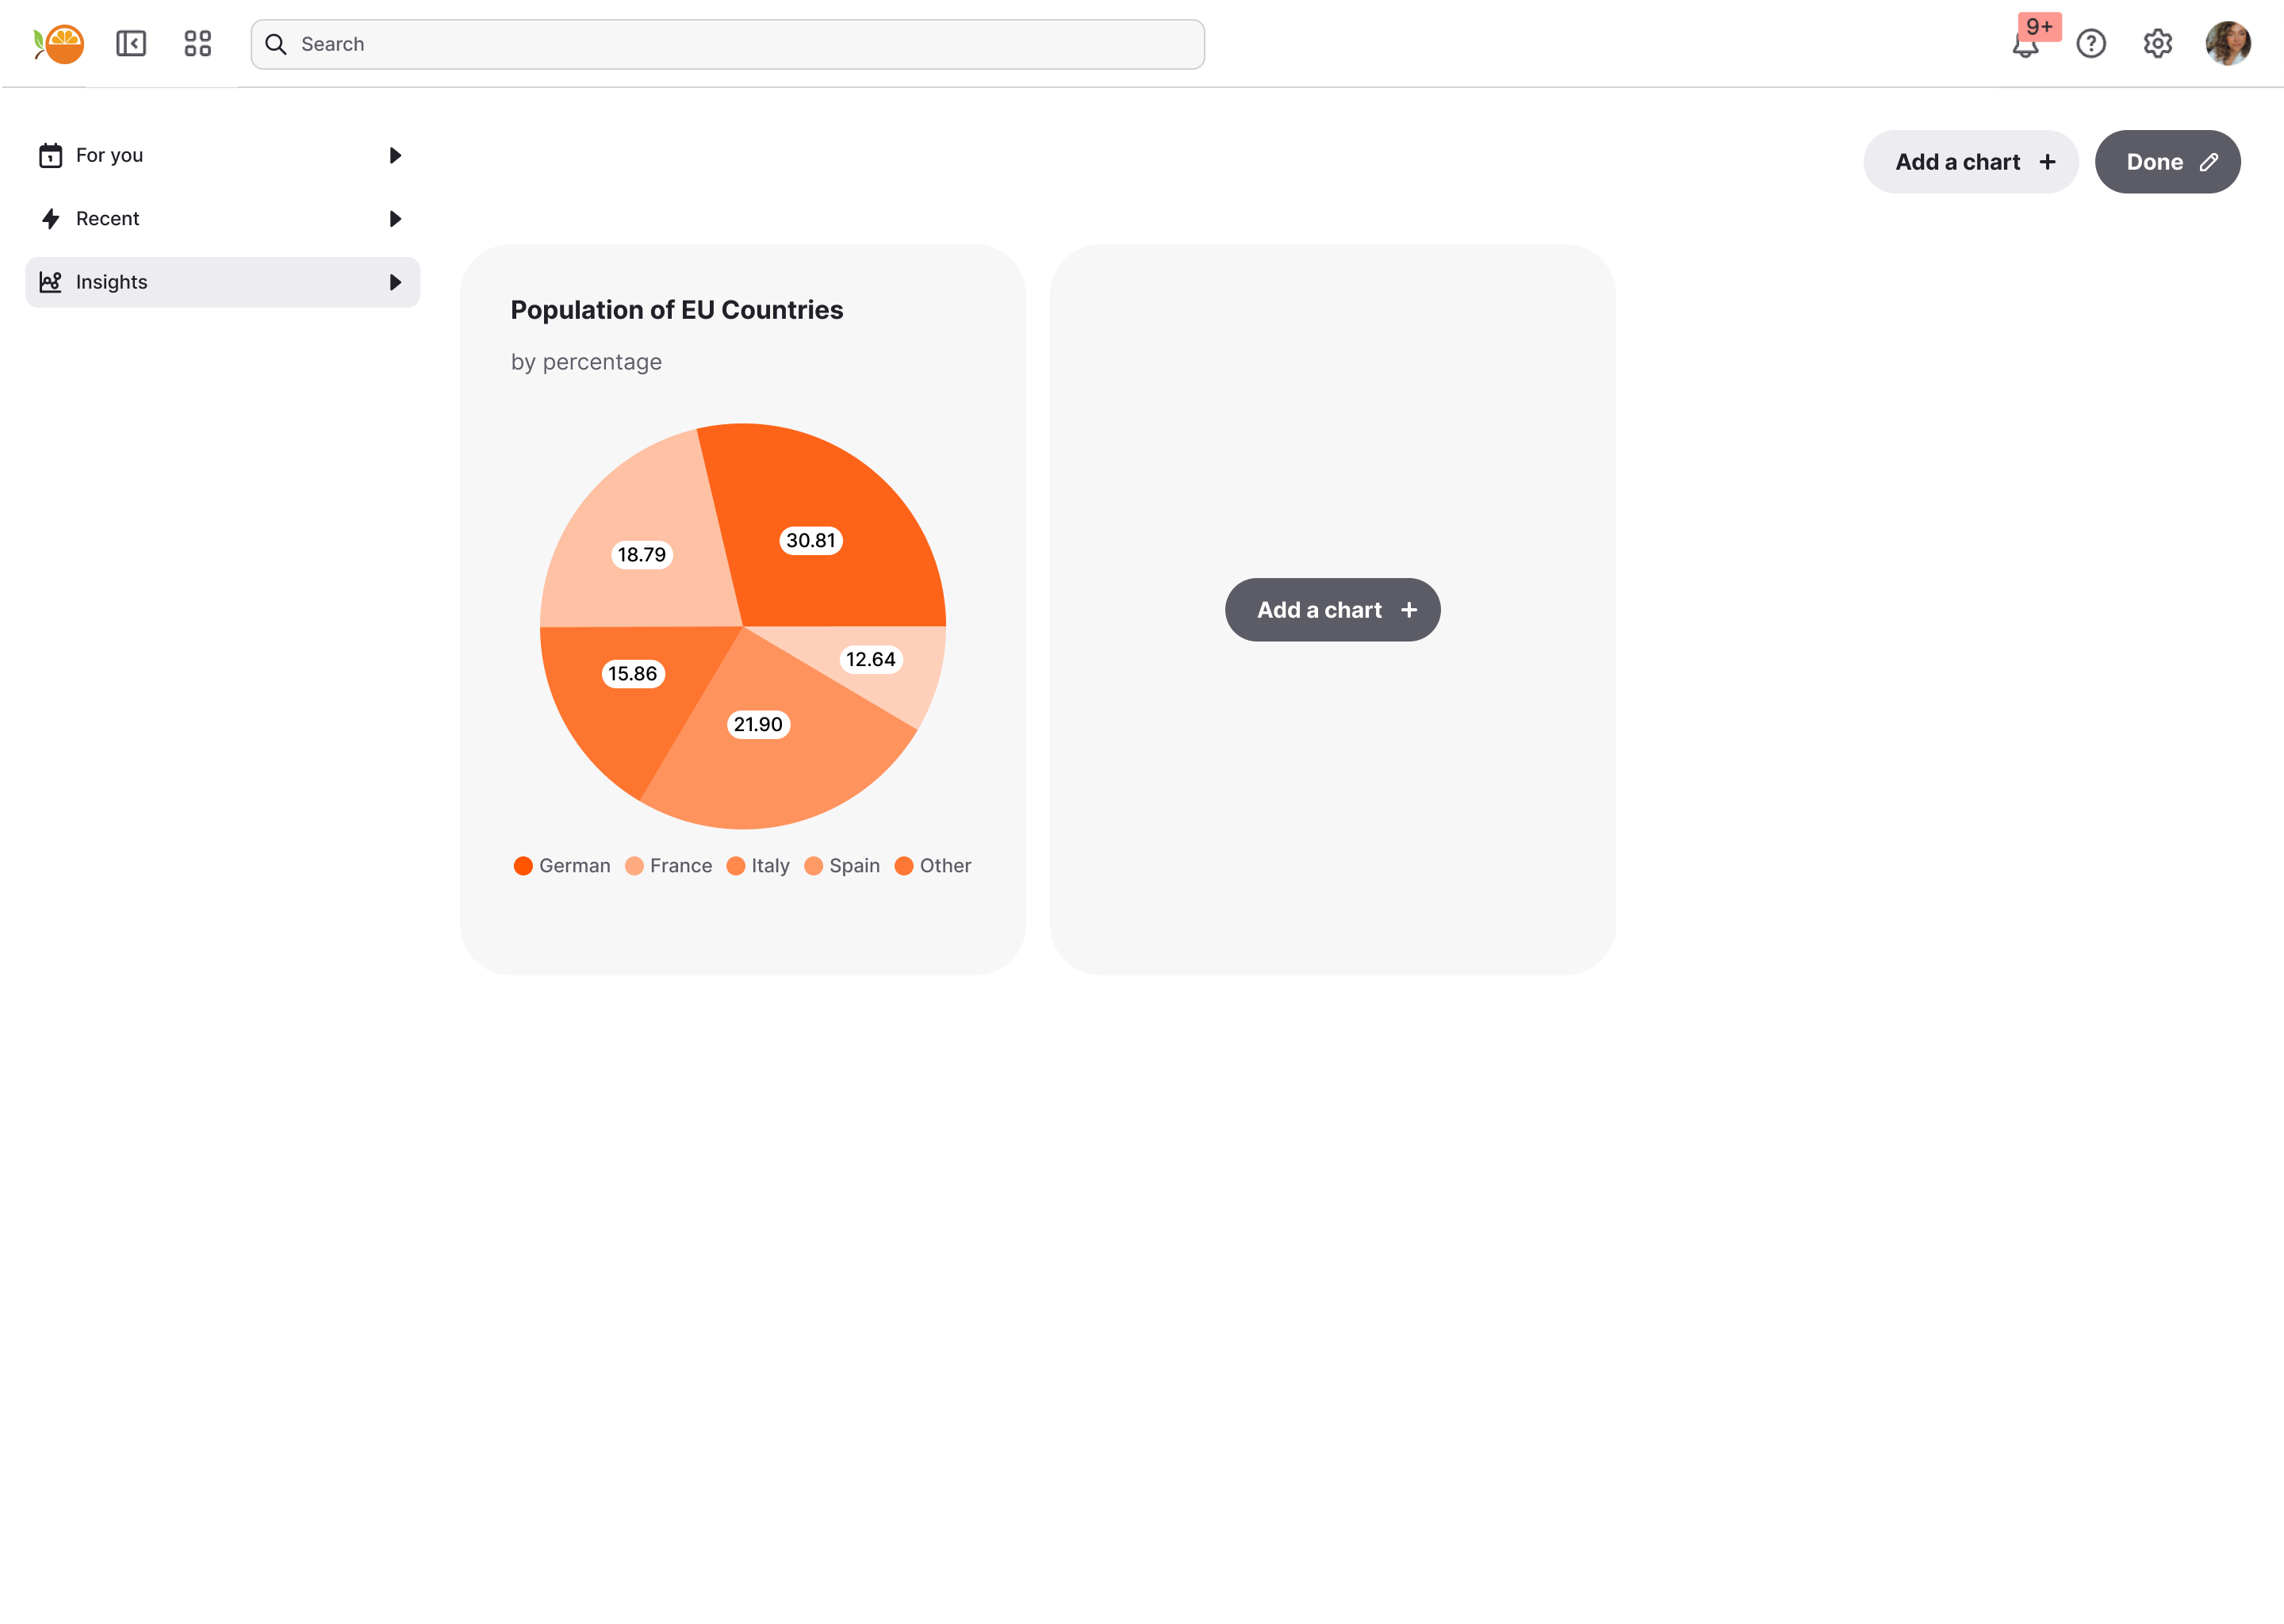
Start with a blank canvas
Your users begin with a clean, empty workspace that feels flexible and approachable. From here, they can create dashboards that reflect their unique priorities.
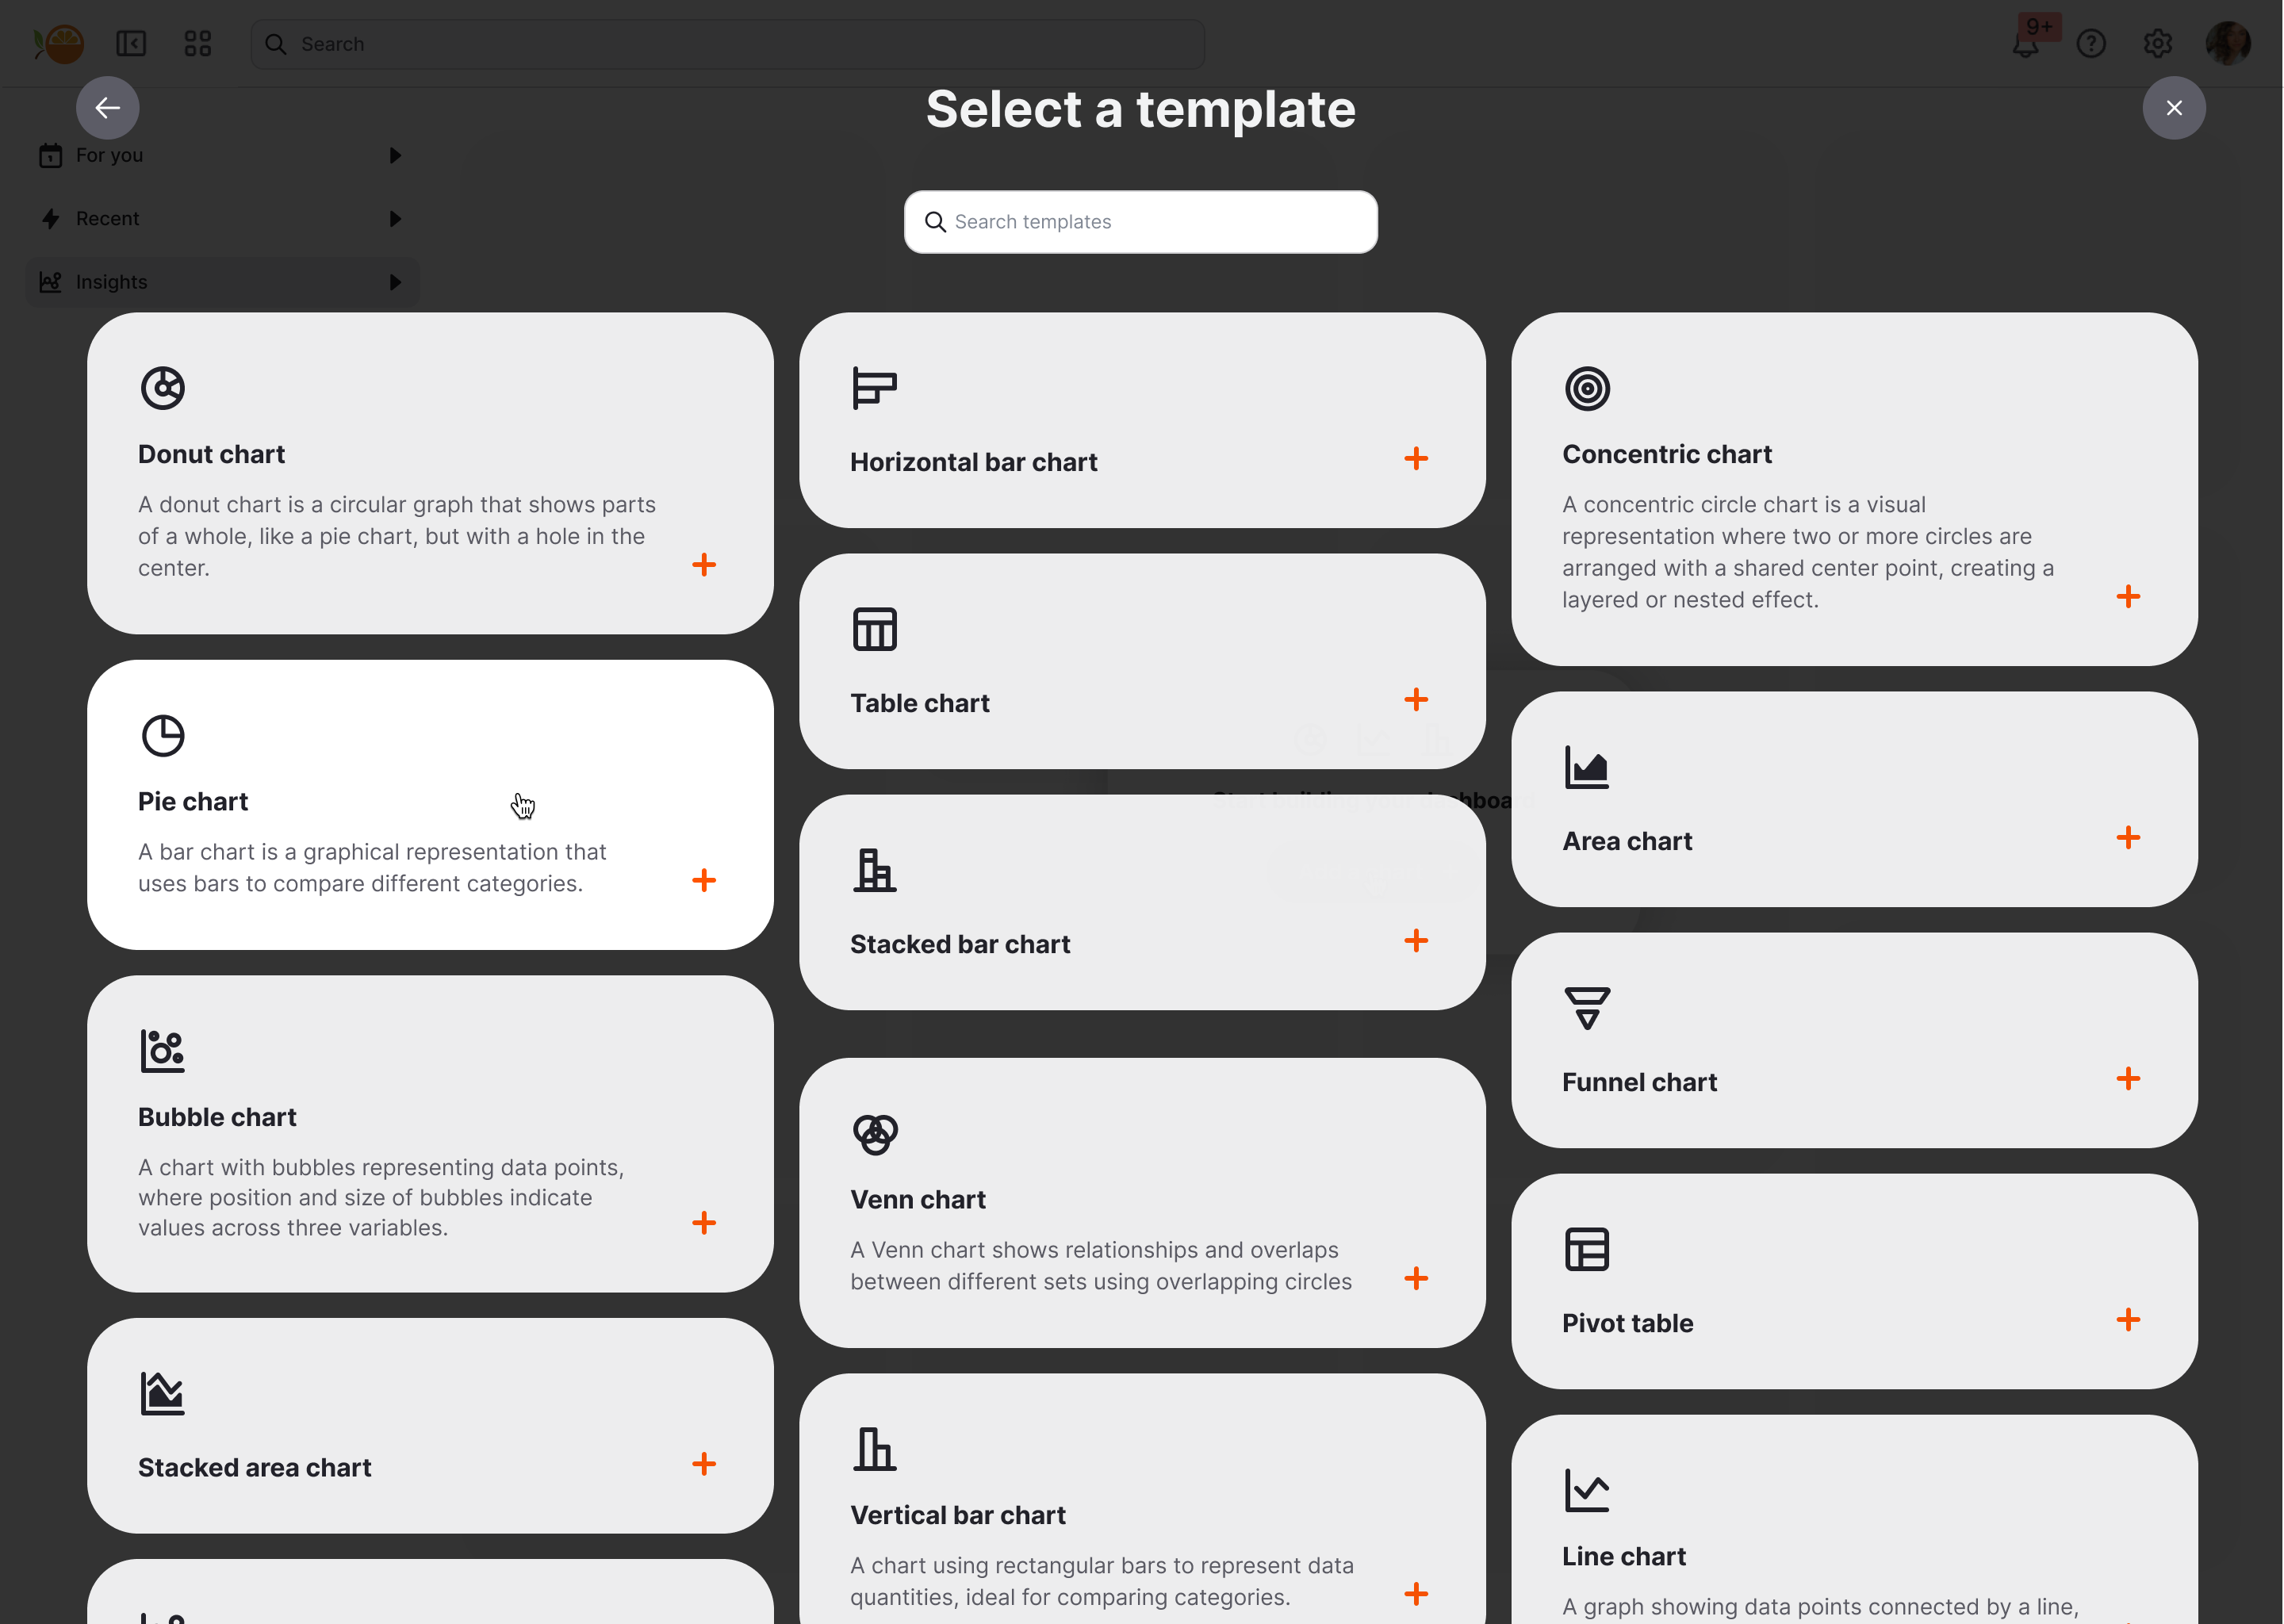
Use pre-built templates
You can provide a library of pre-configured dashboard templates tailored to common use cases. Users simply select one and begin customizing immediately.
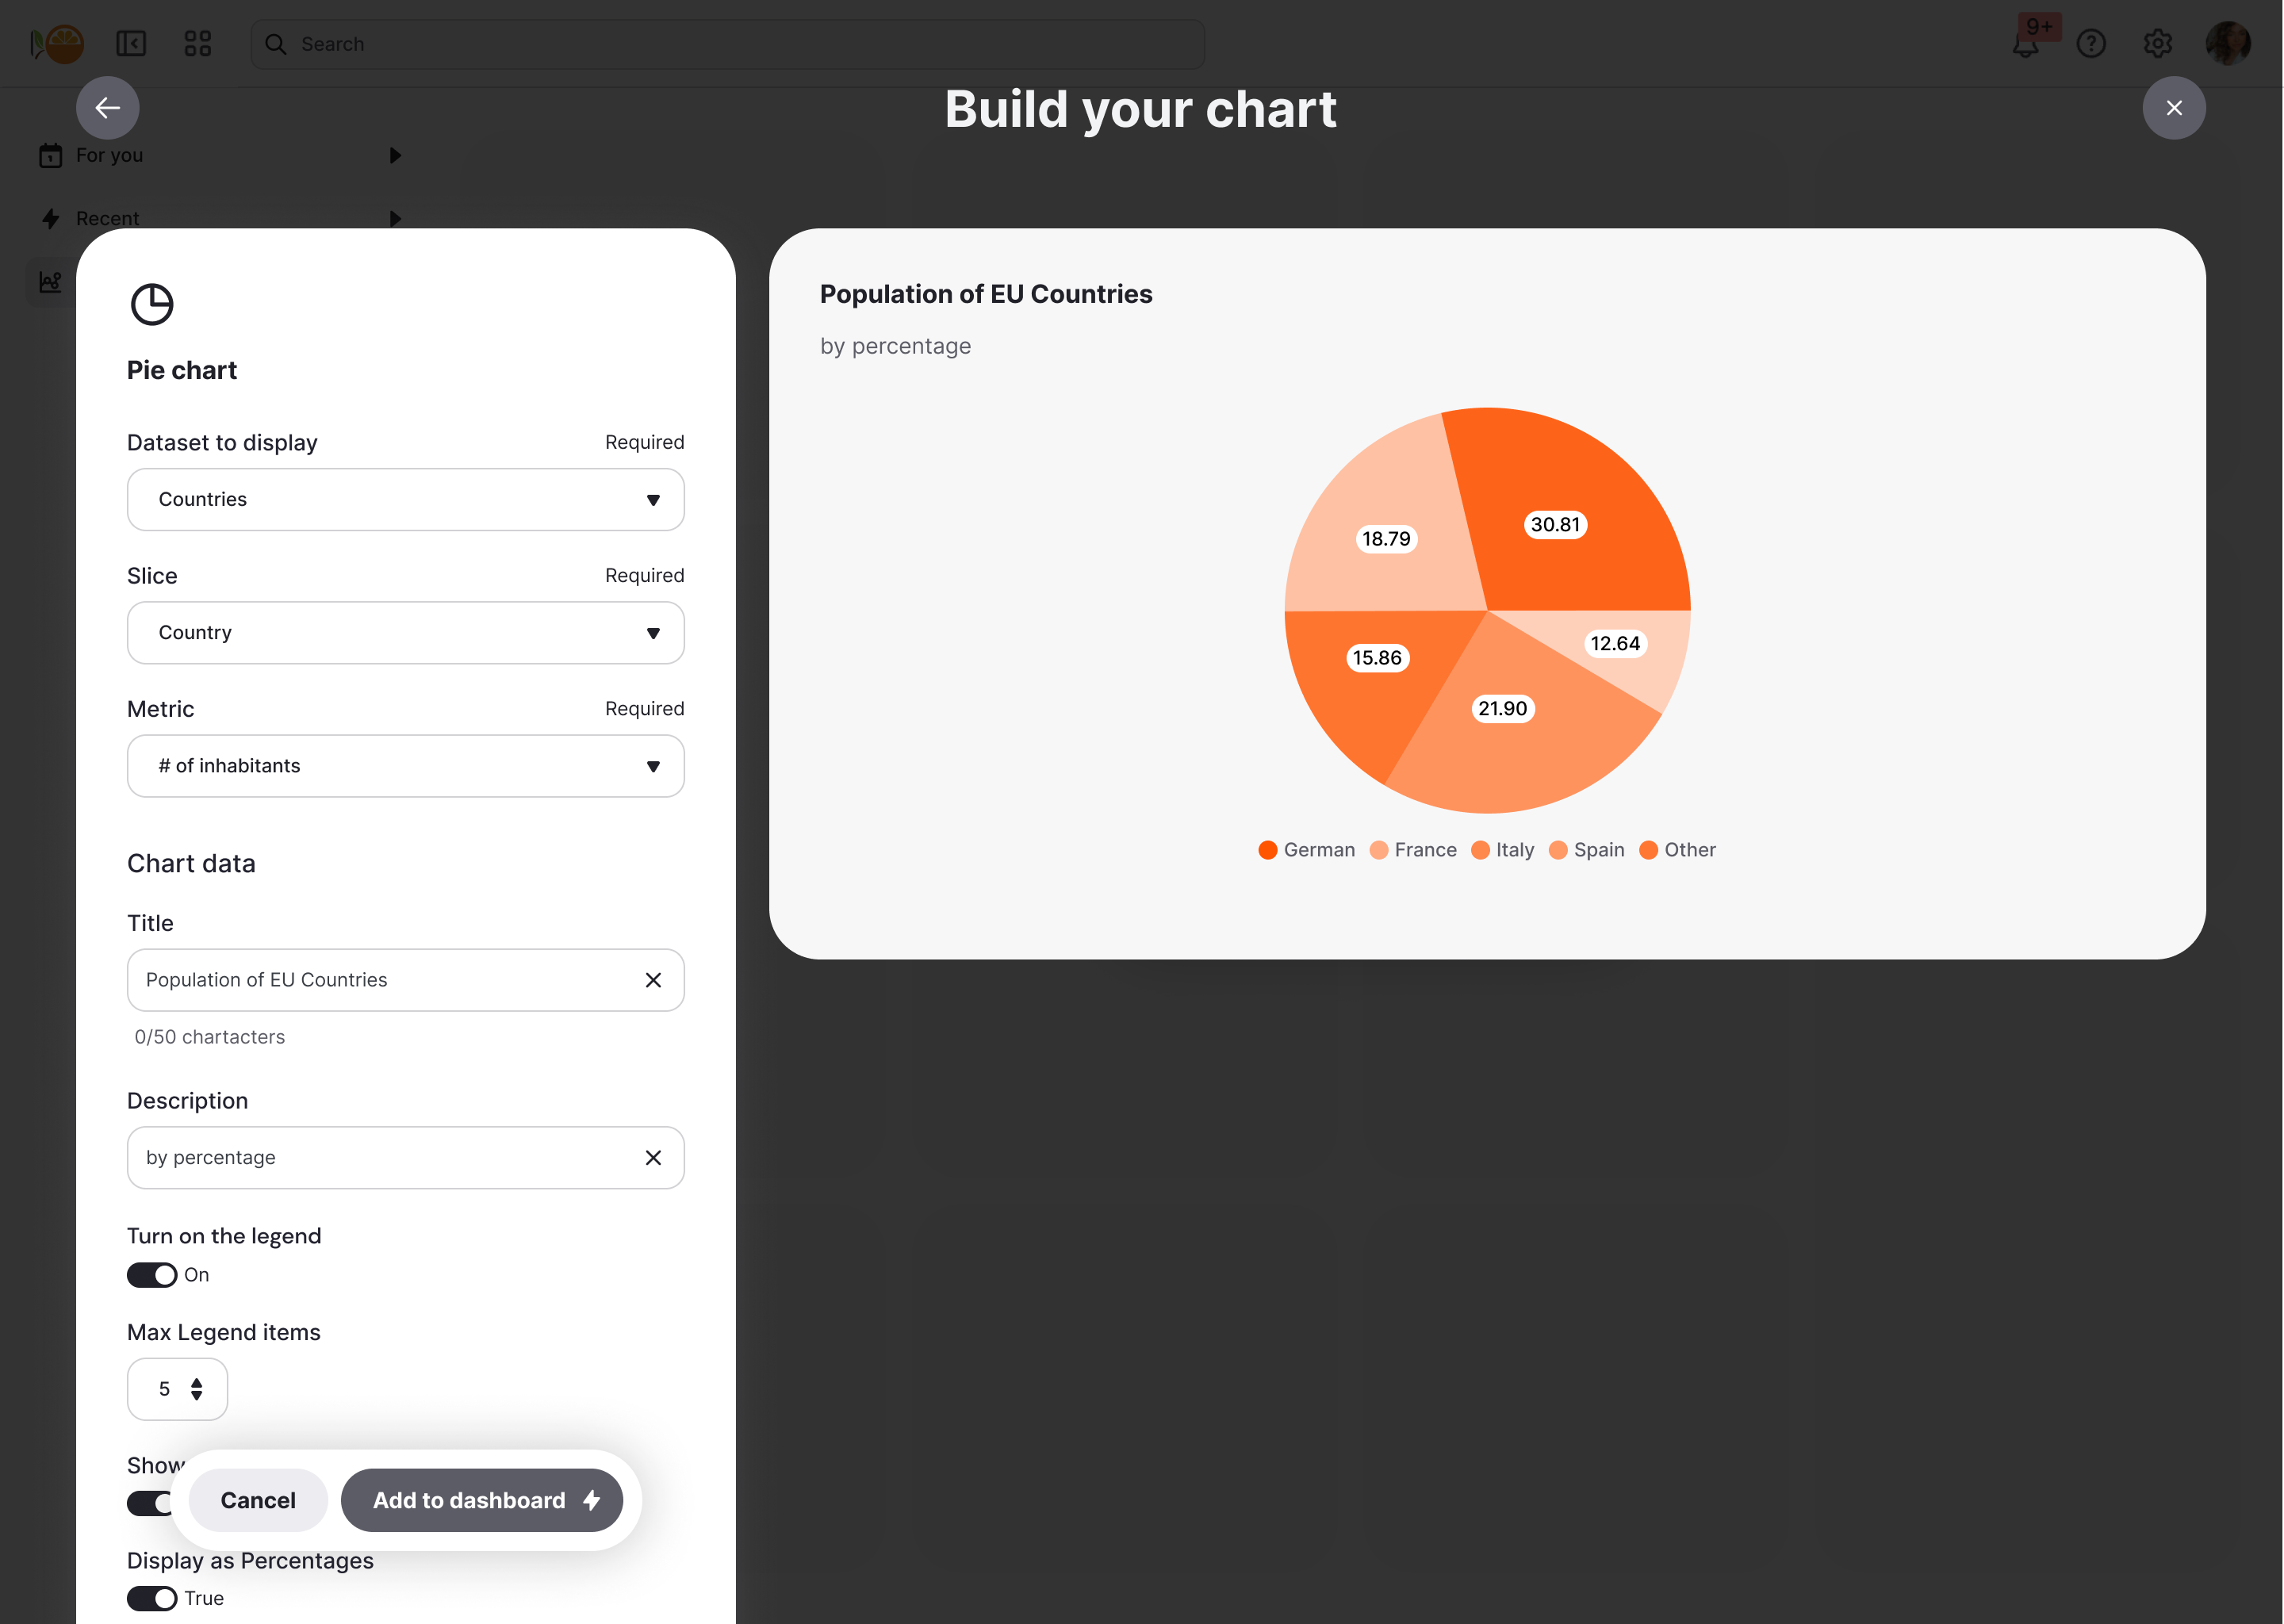
Build charts with guided inputs
Each chart is powered by the data fields you choose to make available. Users select measures or dimensions, and a live preview updates once the required inputs are complete. This strikes a balance between flexibility for them and control for you.
Create multi-chart dashboards
Users can add, arrange, and resize as many charts as they need that tell the story of their data.
Combine Custom Canvas and fixed content
Sometimes you want to set context. Custom Canvas supports hybrid dashboards, where you can fix key charts, metrics, or explanatory text at the top—while still allowing users to build their own canvas beneath.

How you build it
Custom Canvas is designed to give your users flexibility—while keeping you, the builder, fully in control of the datasets, templates, and rules they can use. Here’s how you set it up.
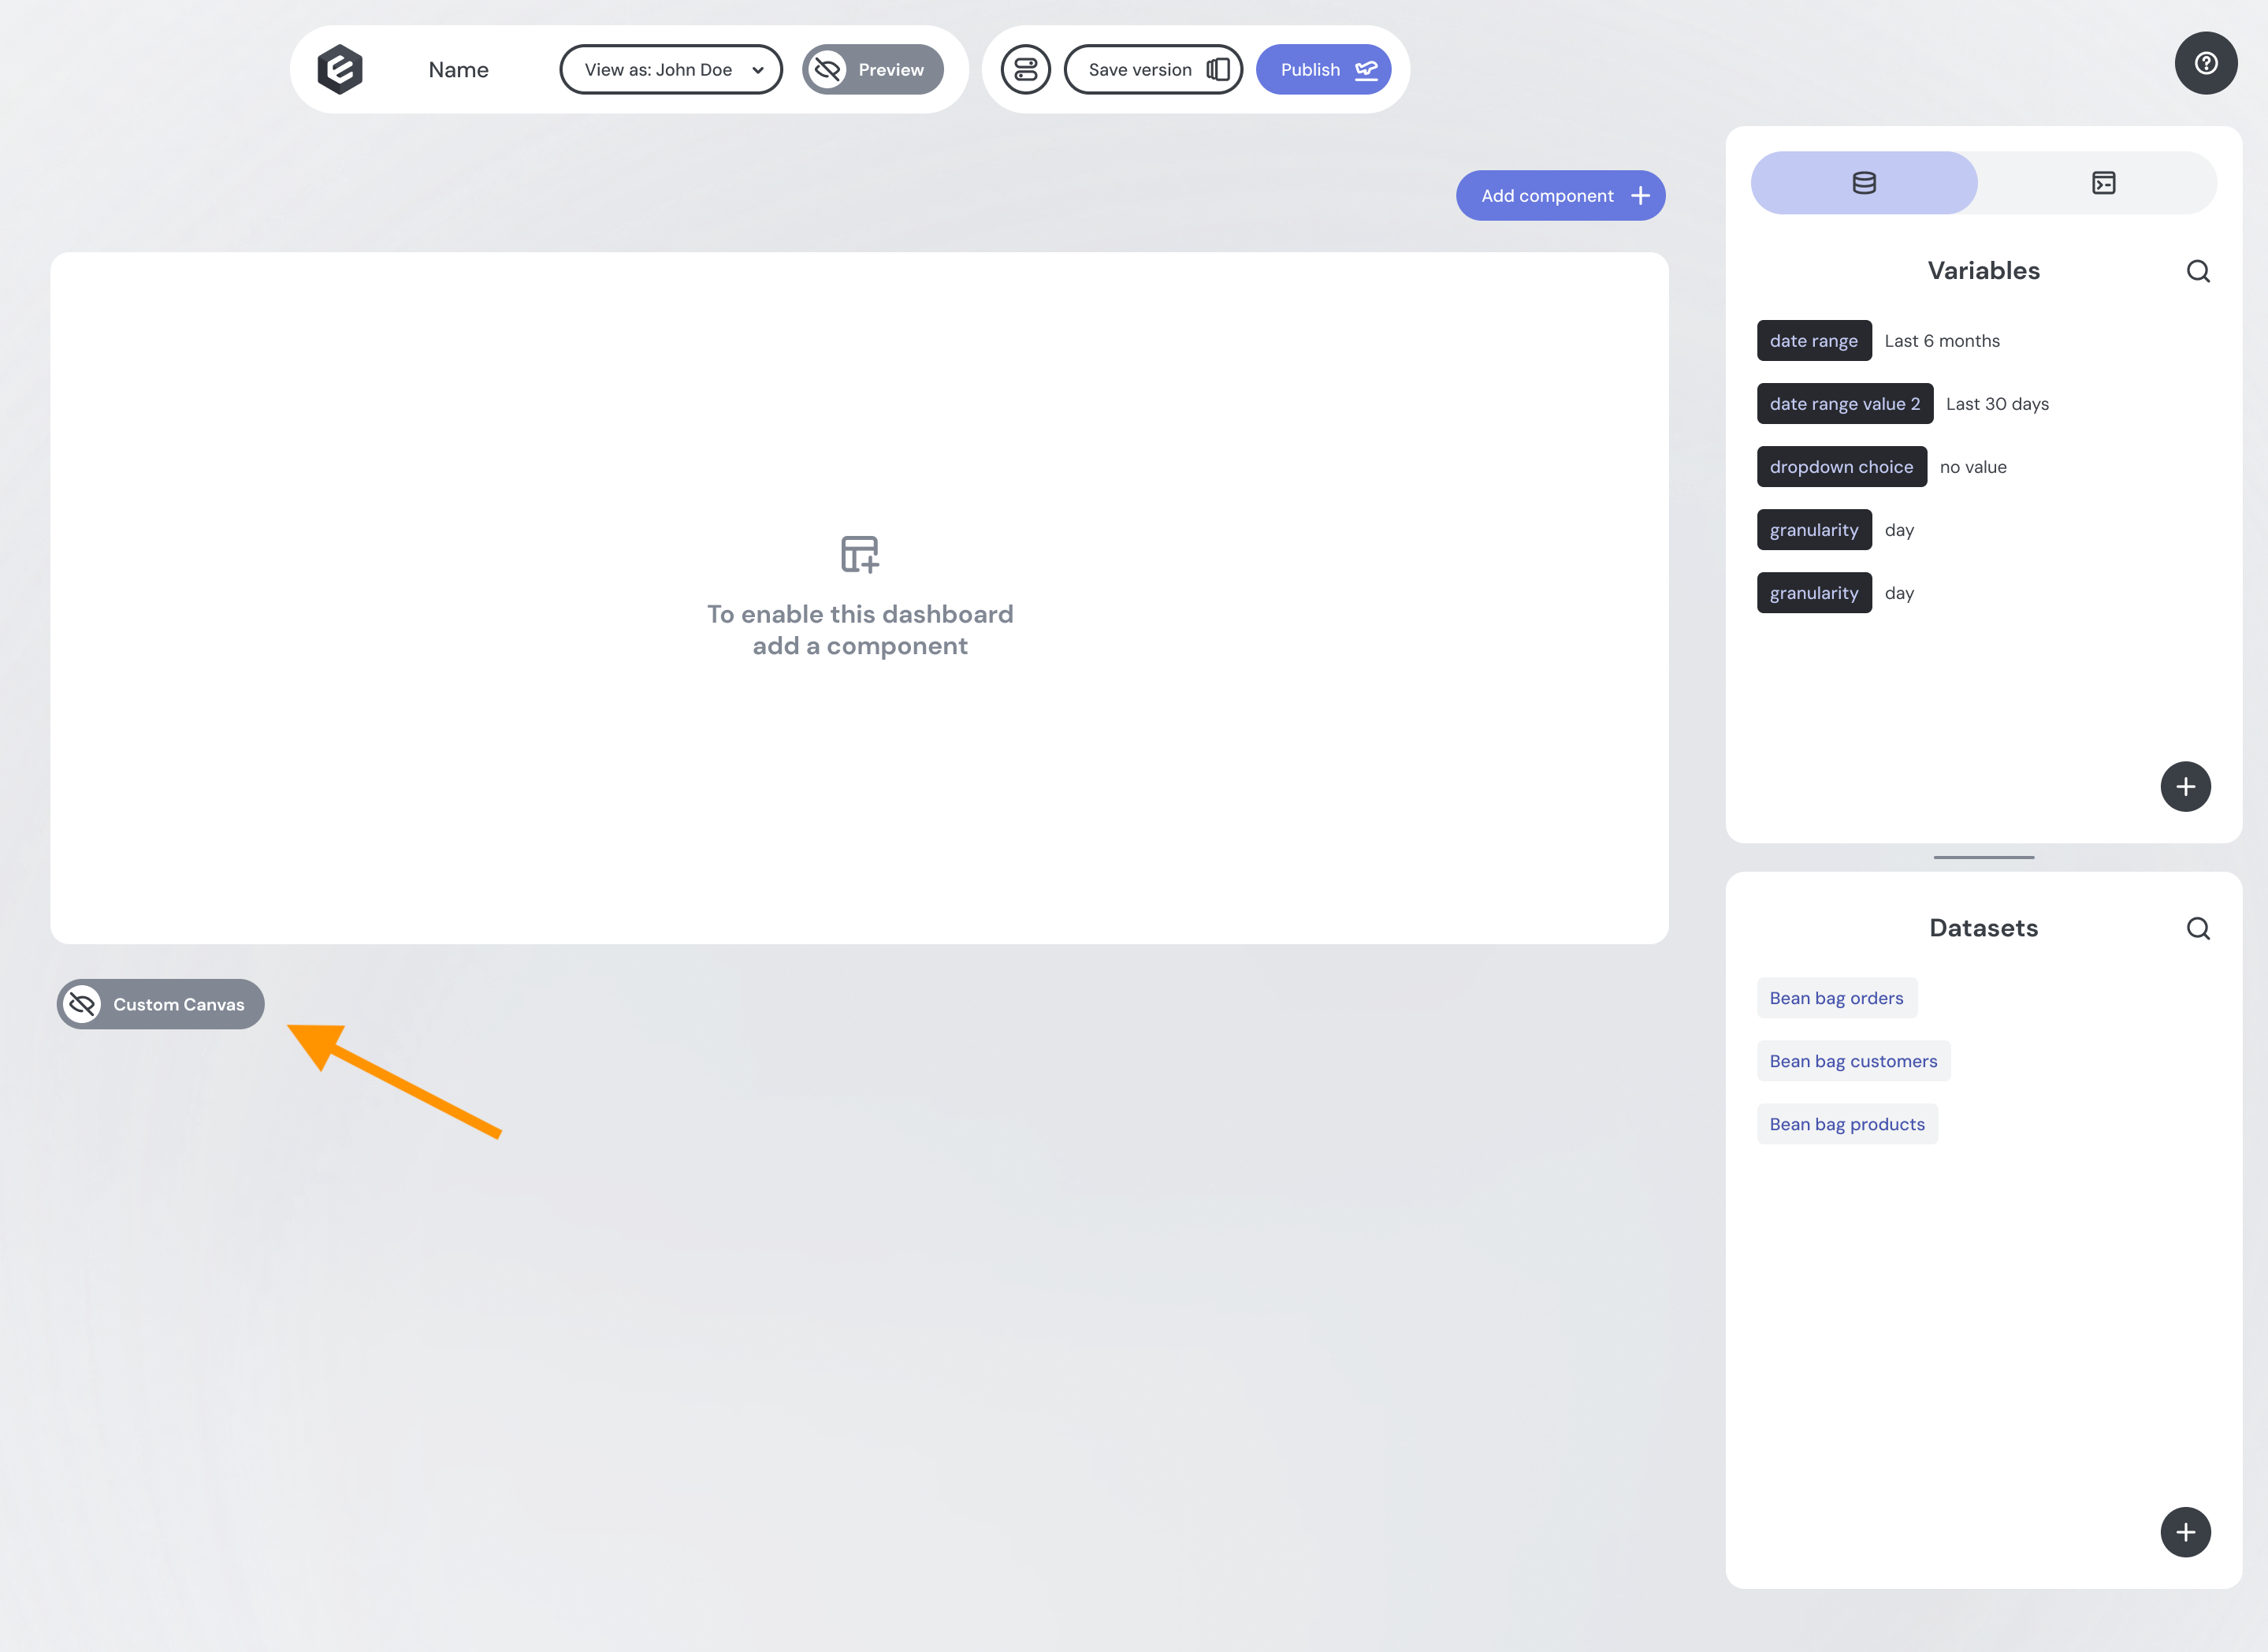
Activate Custom Canvas
Turn on Custom Canvas by using the toggle beneath your main canvas. This opens up configuration options specific to user-created dashboards.
Select Available Datasets
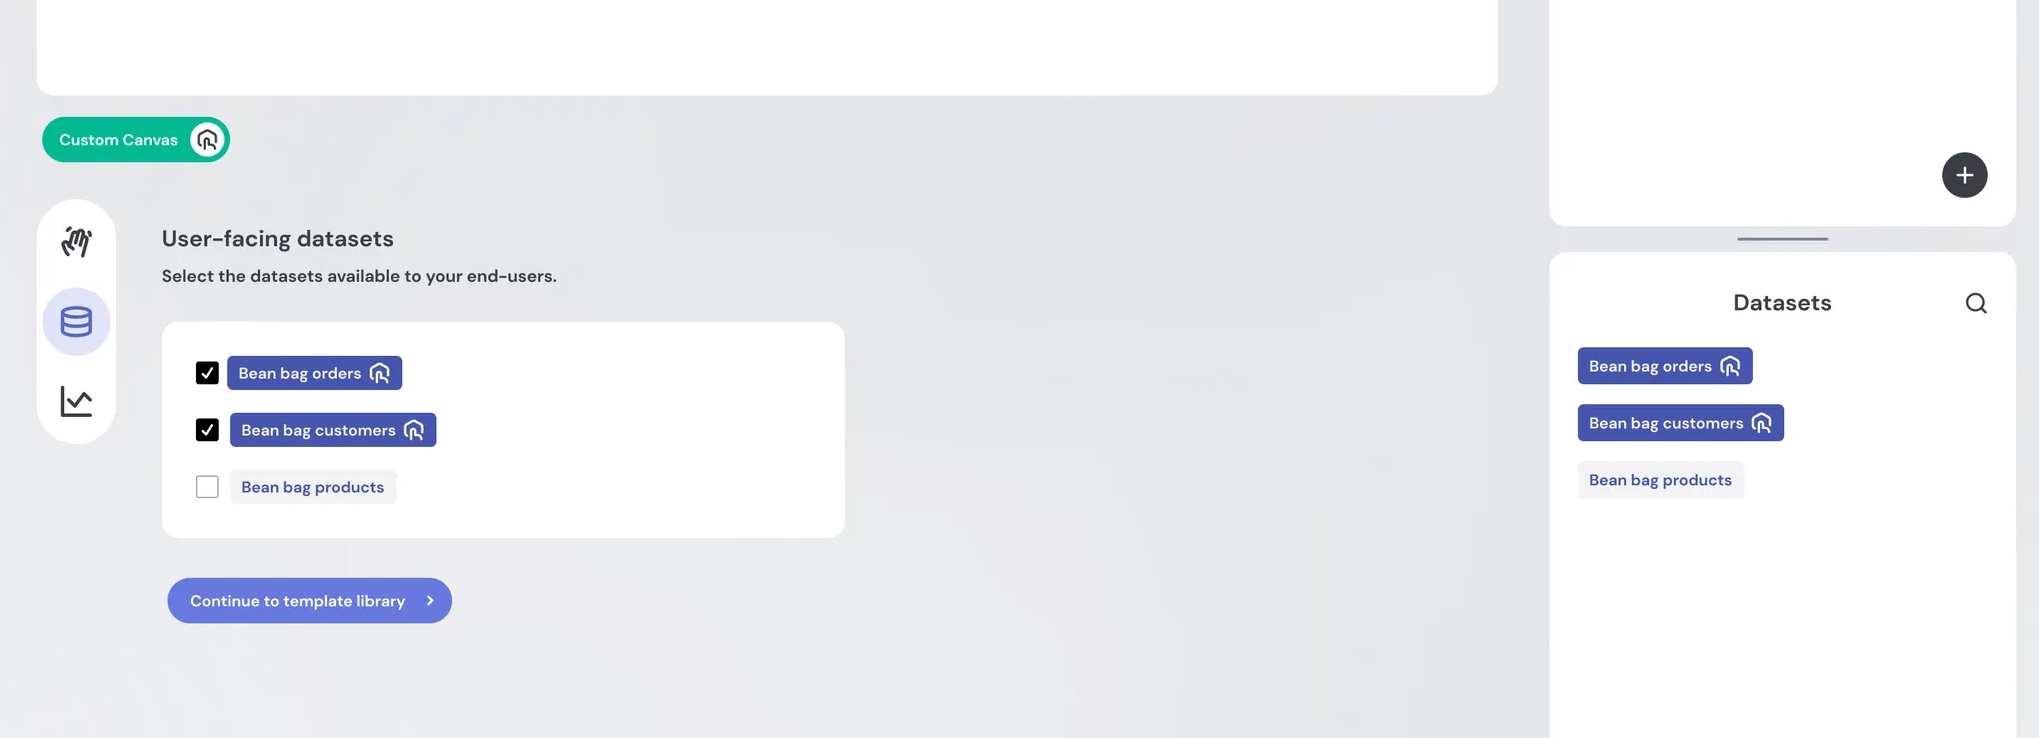
In the Datasets section, select which datasets your users should be able to access.
- Datasets available to your users are highlighted in bright purple.
- This makes it easy to distinguish between data powering your main dashboards and the data you want to expose for user exploration.
Your data team can apply fine-grained control over what dimensions and measures are available to end-users using Views and Access Policies.
Build a Library of Templates
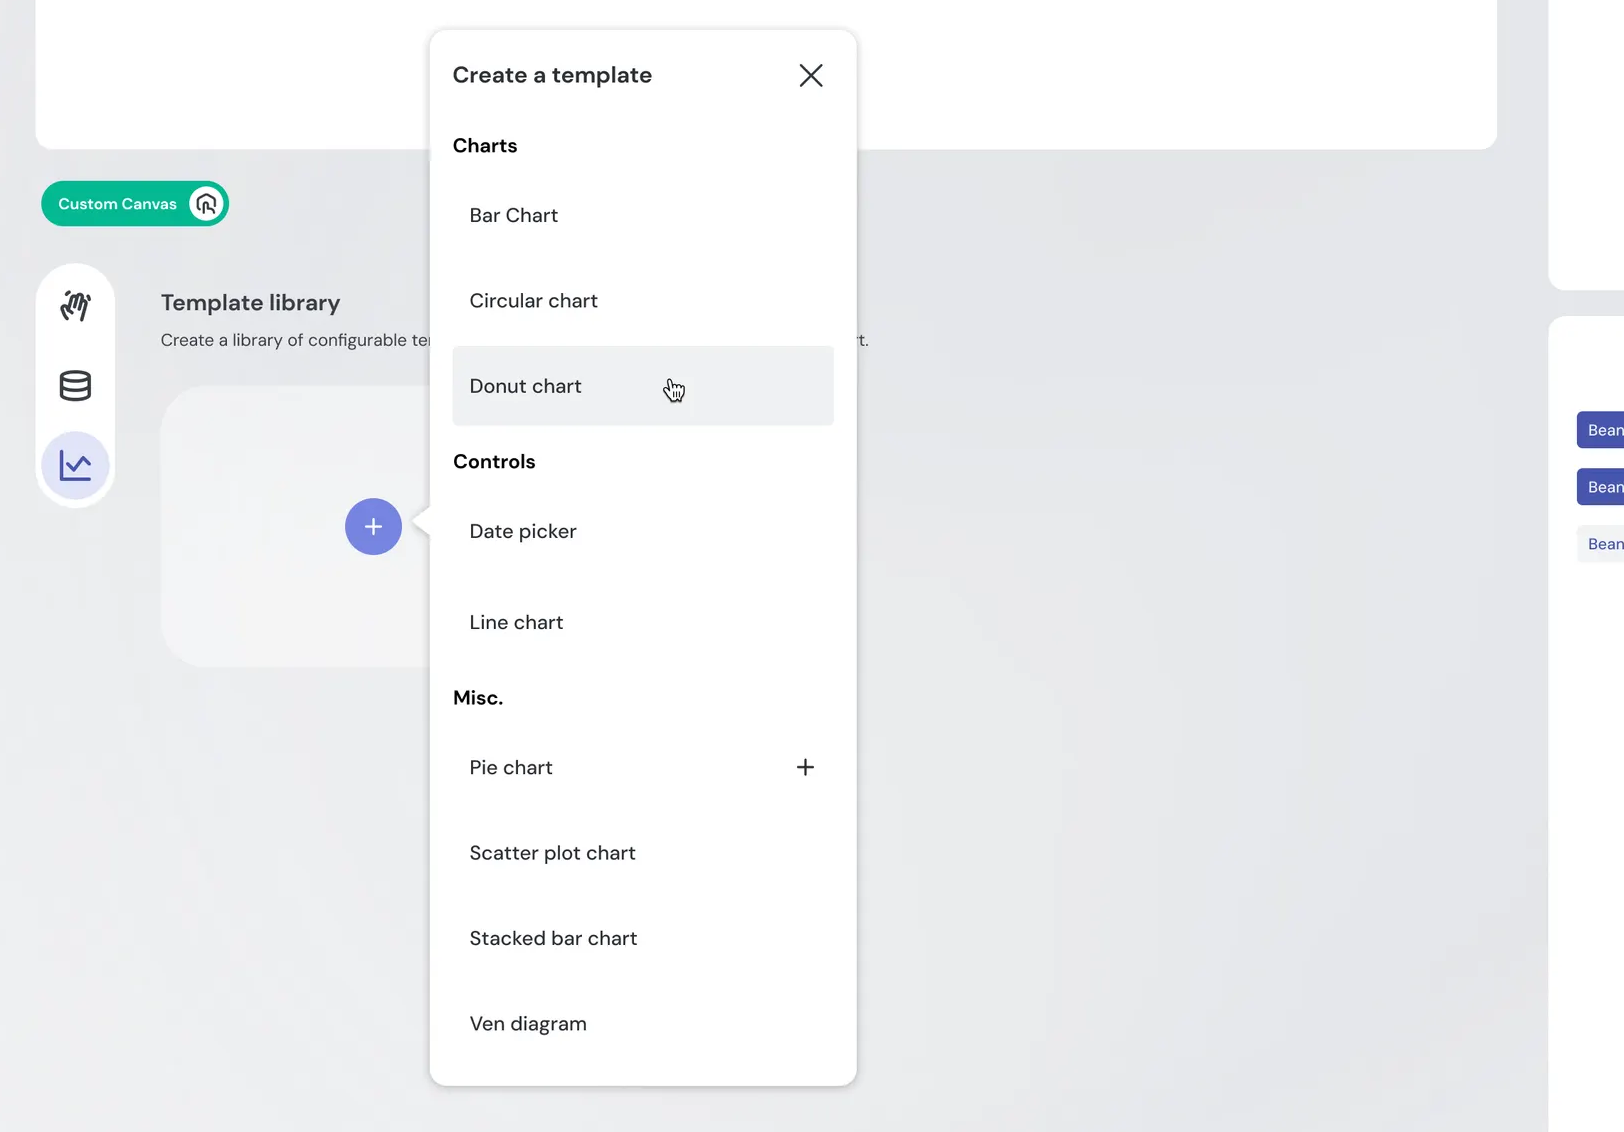
Next, go to the Template Library tab to create reusable templates. These come from your existing component library (e.g., pie chart, donut chart, bar chart).
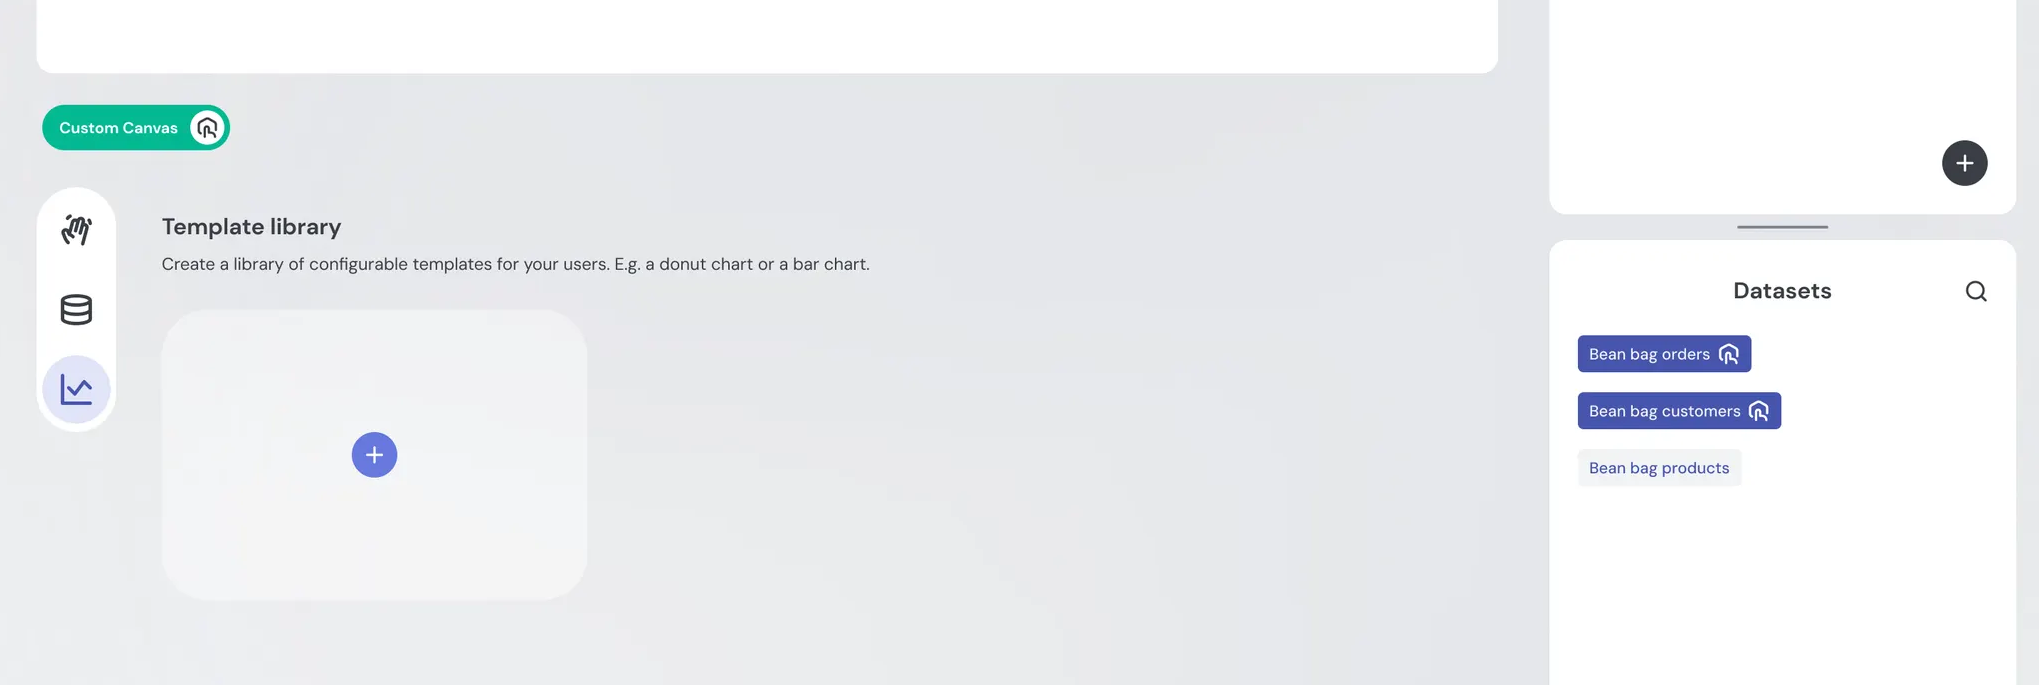
Start by selecting a chart from your component library
Configure Chart Inputs
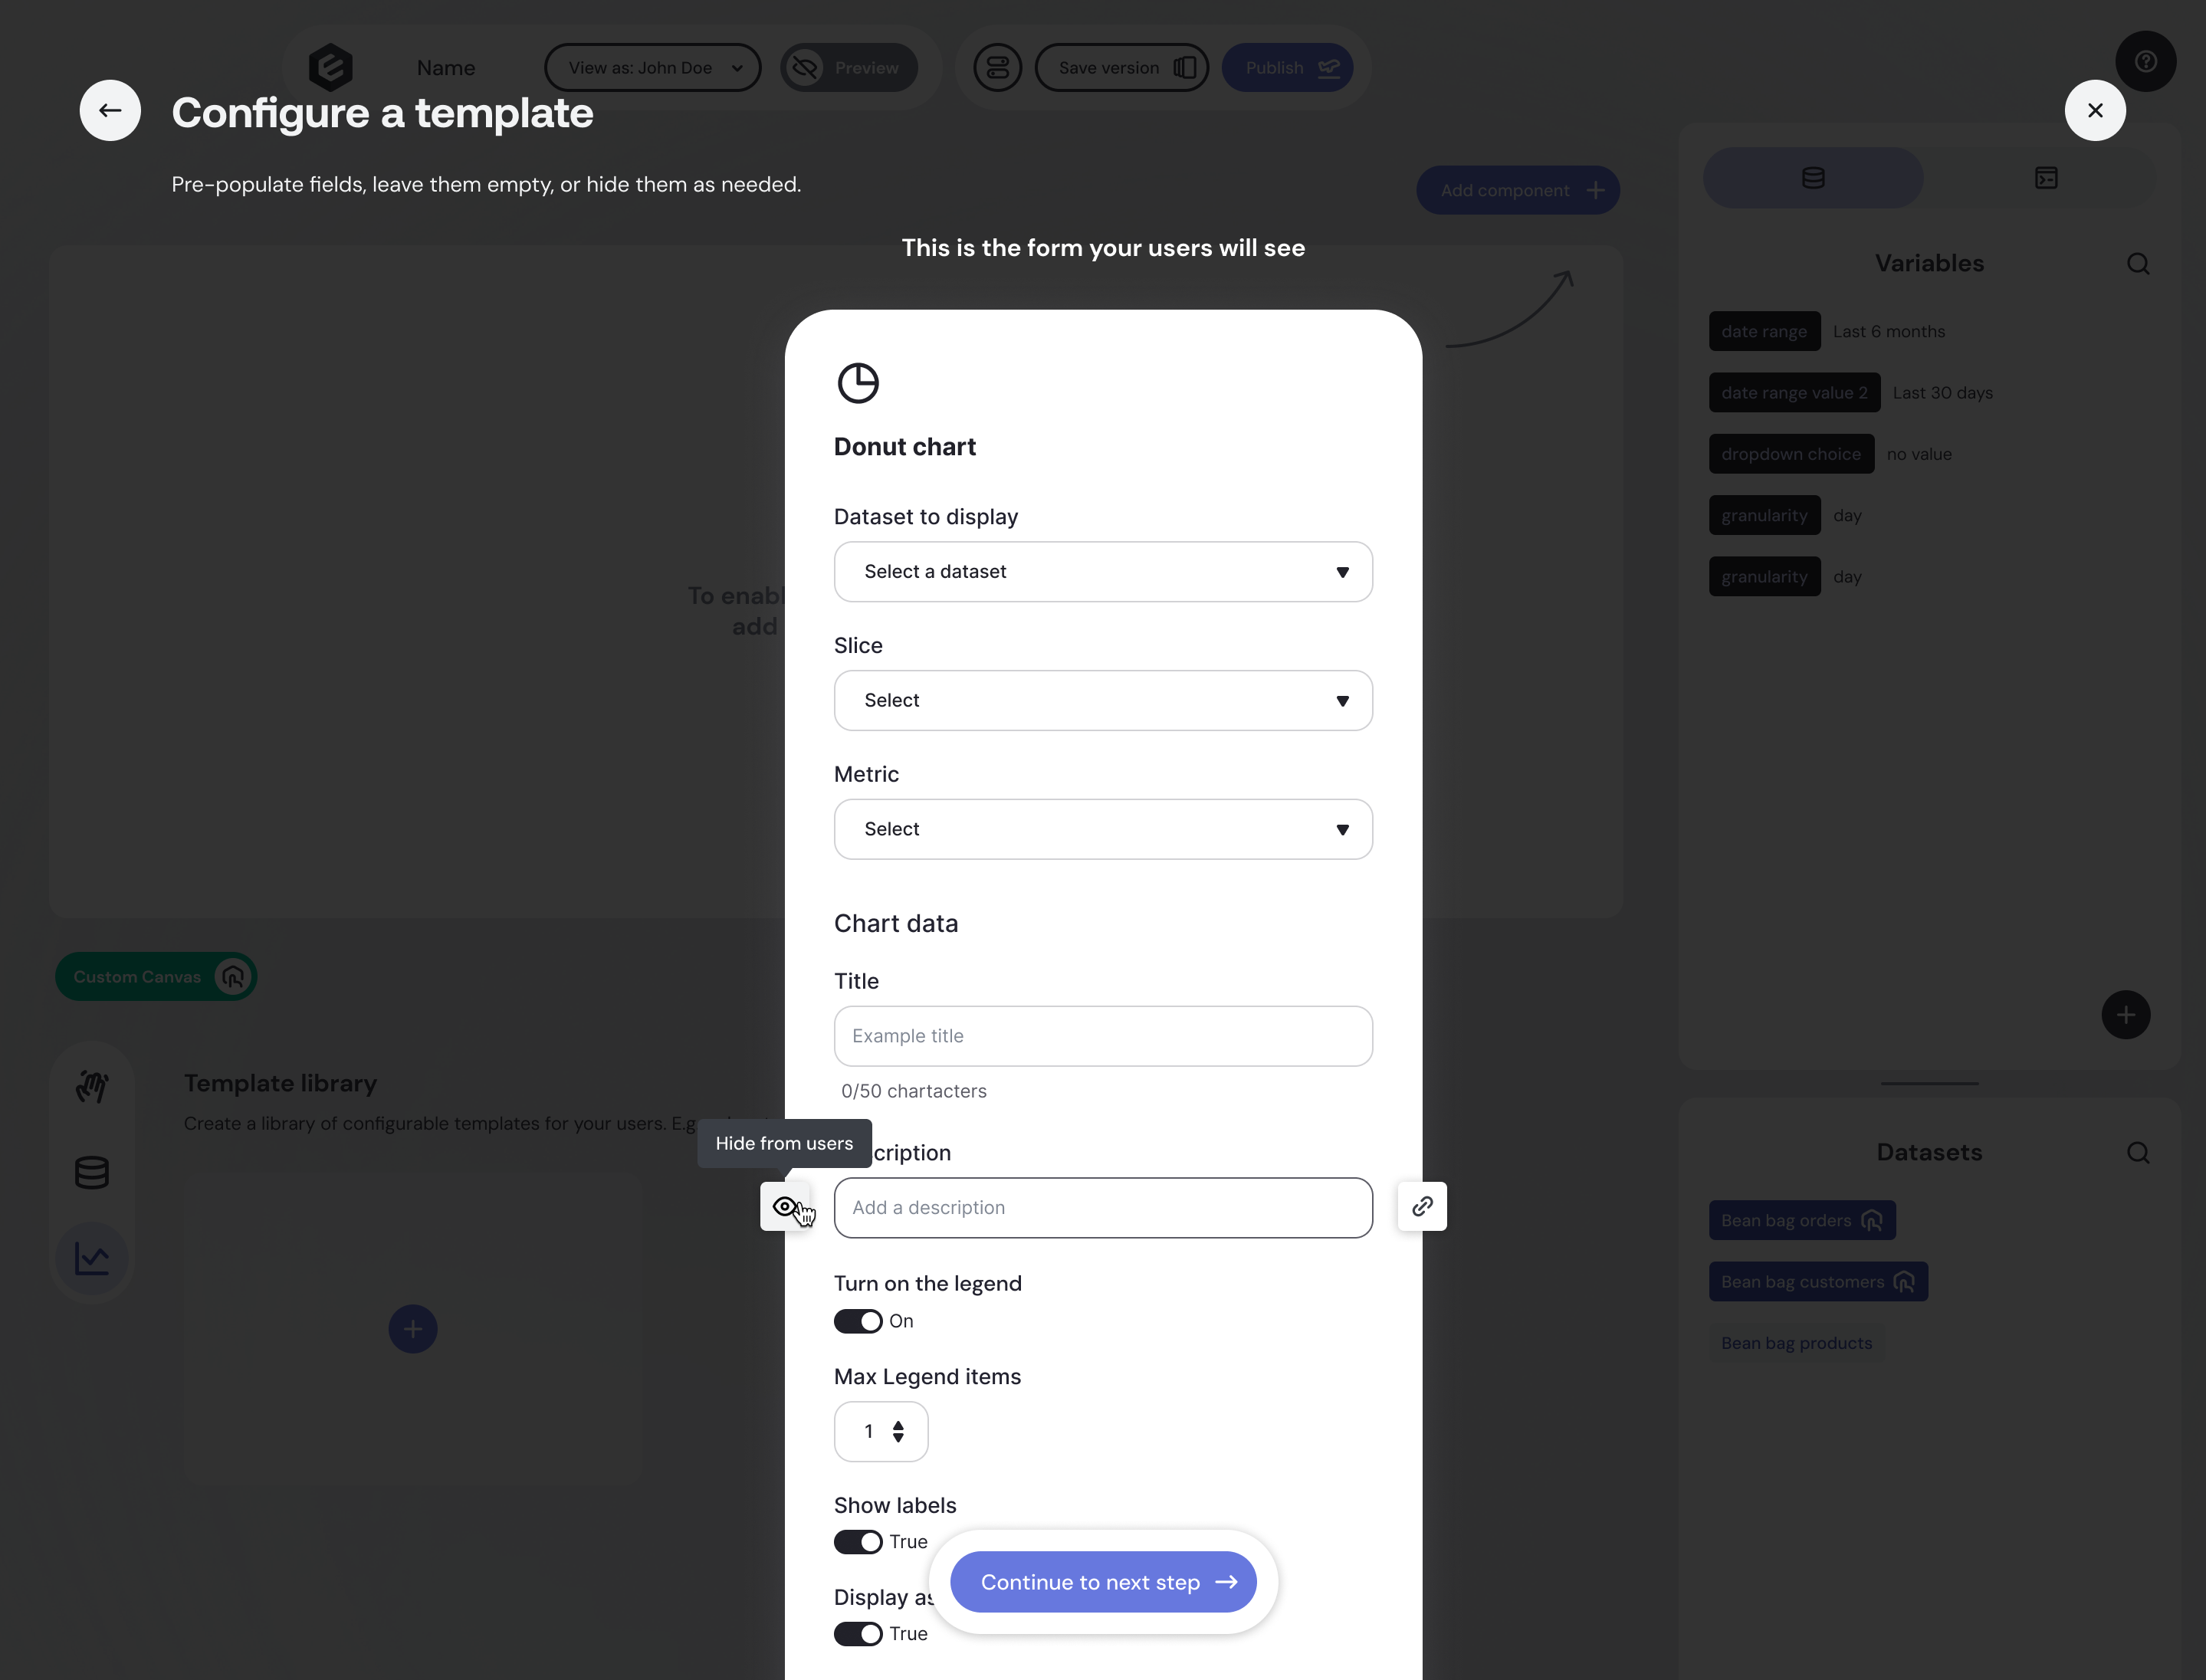
Define the fields your users will interact with when creating their charts:
- Pre-populate fields for a guided experience.
- Leave fields empty to give users freedom.
- Hide fields entirely to keep complexity out of sight.
This balance lets you control how much flexibility users have.
Your templates can be connected to variables that are manipulated by various controls (dropdowns, datepickers, etc) just like in regular dashboards. Simply attach inputs to variables as you would normally, and they'll carry through in your templates.
Best practice: keep your controls in the standard section of your dashboard, rather than in the Custom Canvas area. We don't recommend adding controls as templates to the Custom Canvas template library, as they will not necessarily work correctly (and may lead to a confusing user experience).
Name and Describe Templates
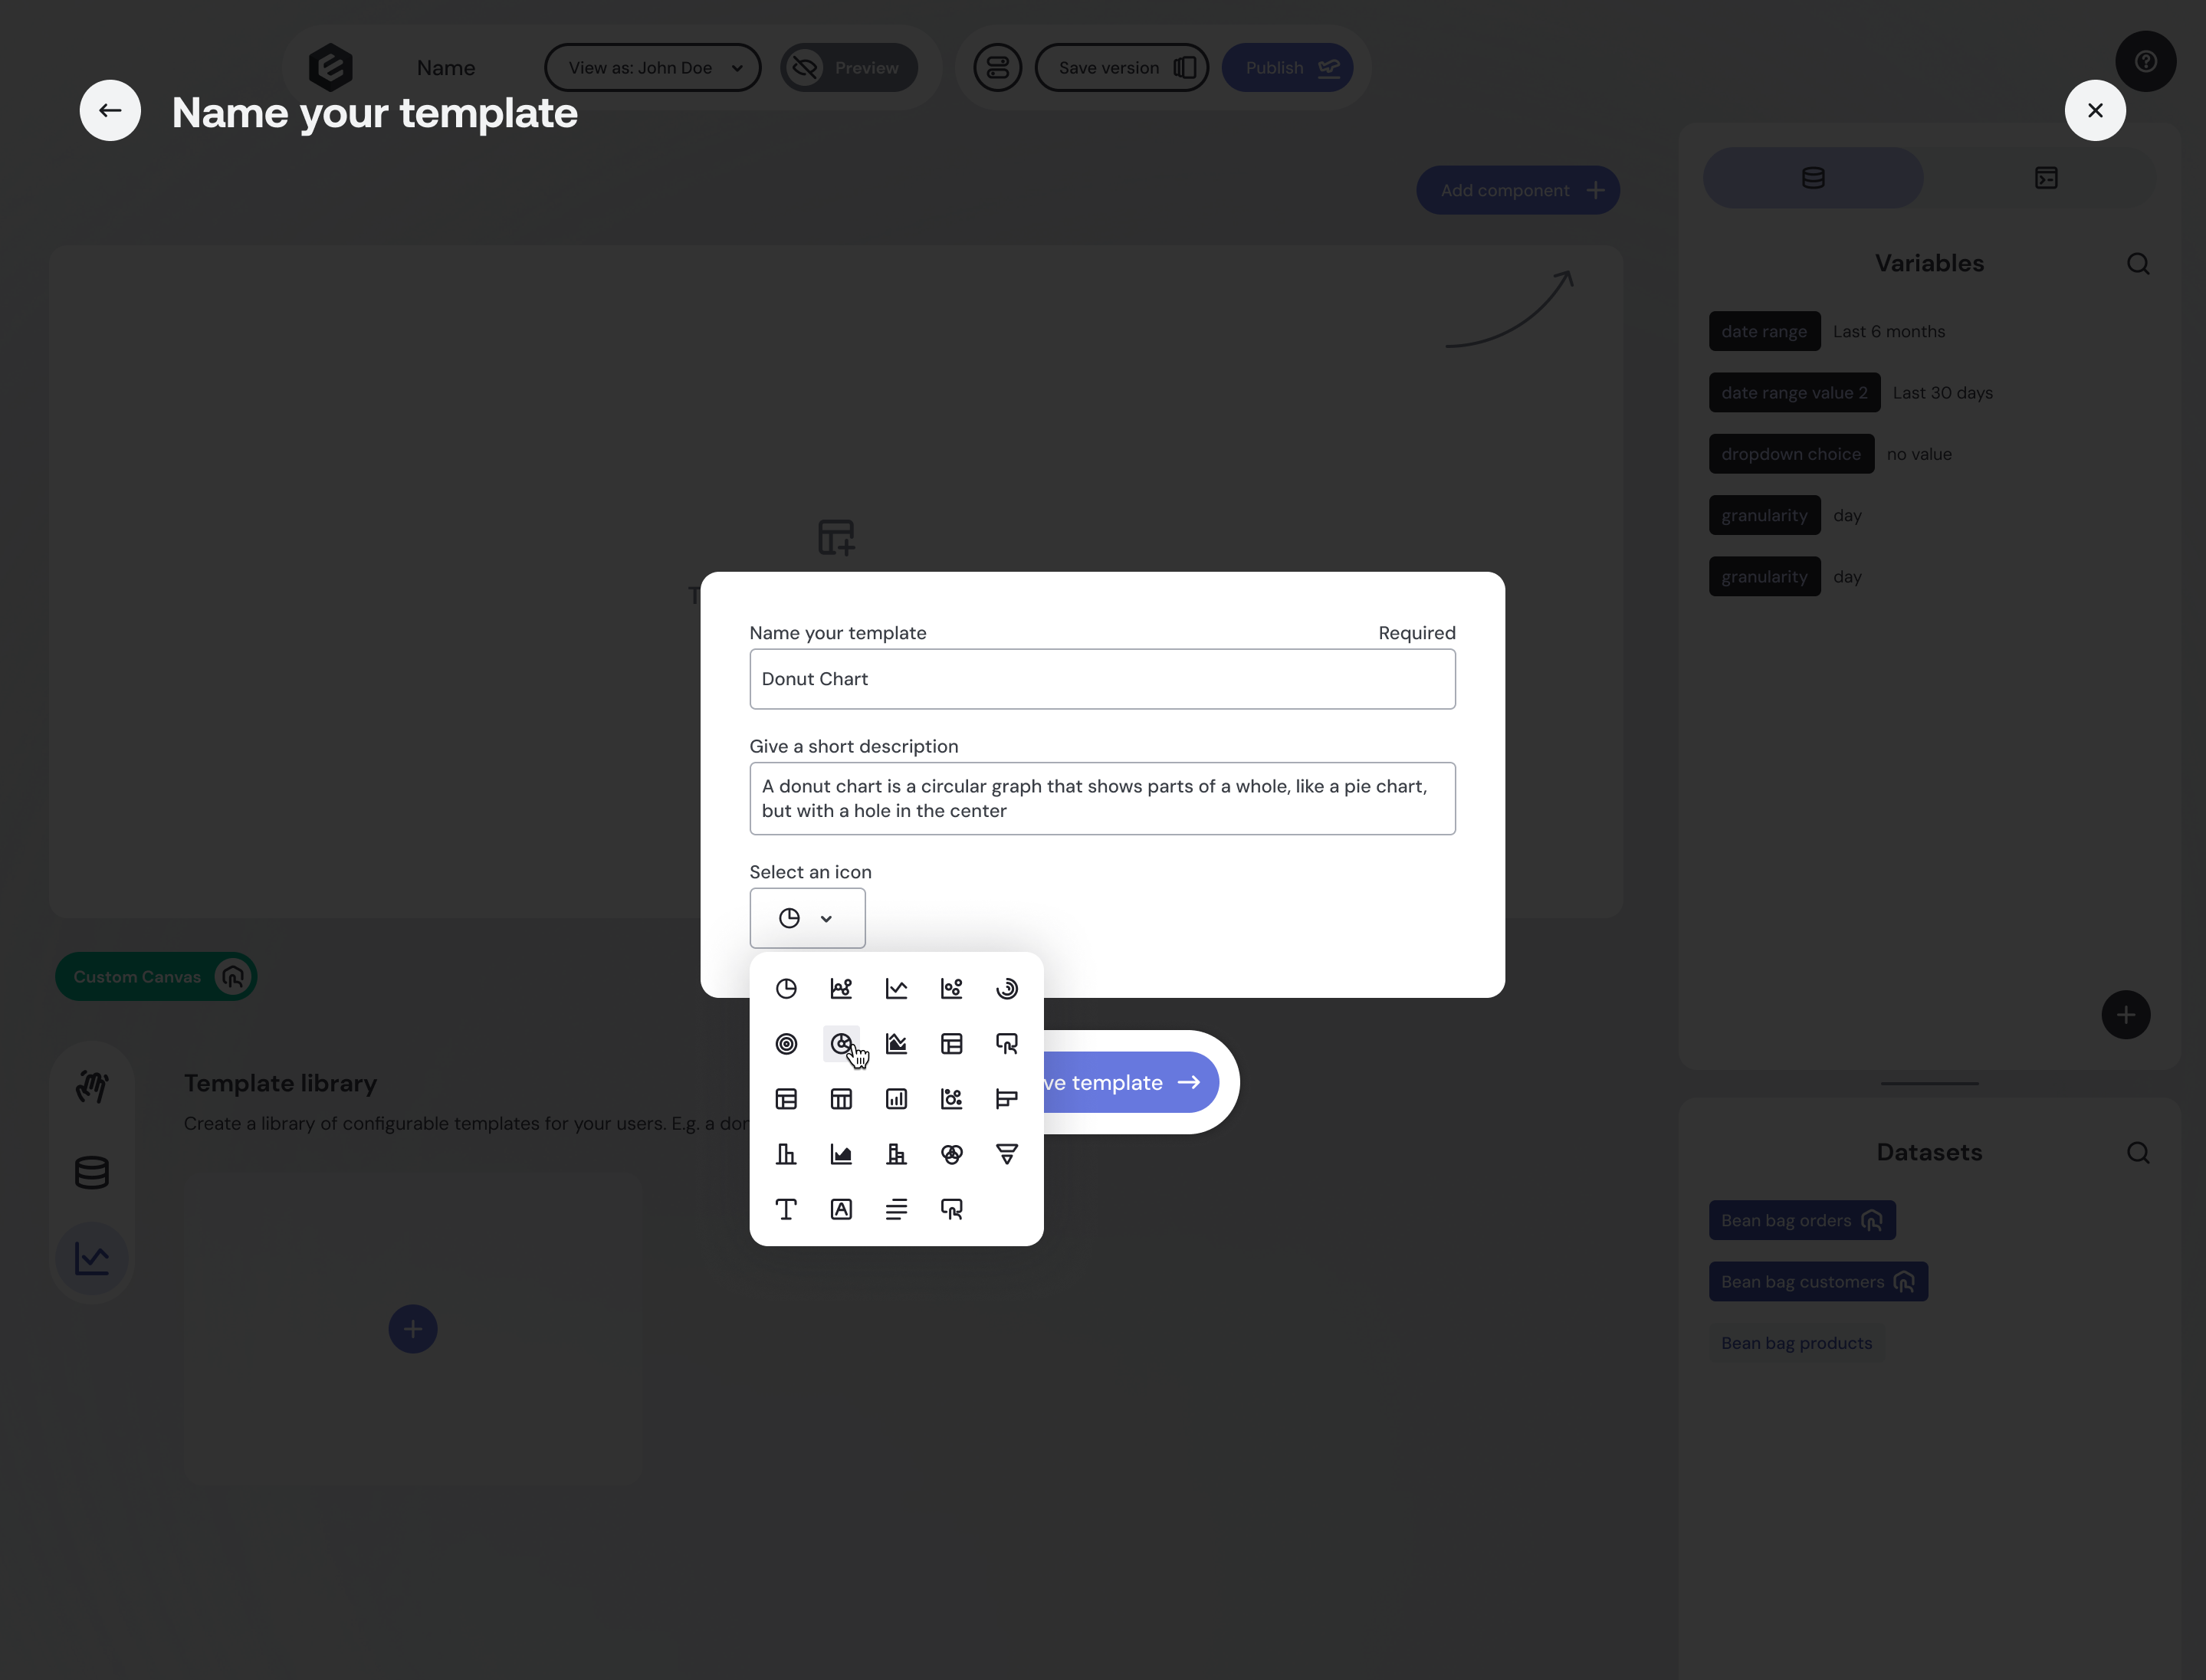
Give each template:
- A name
- An optional description
- A distinctive icon
This helps users easily differentiate between chart types when building dashboards.
Manage and Organize Templates
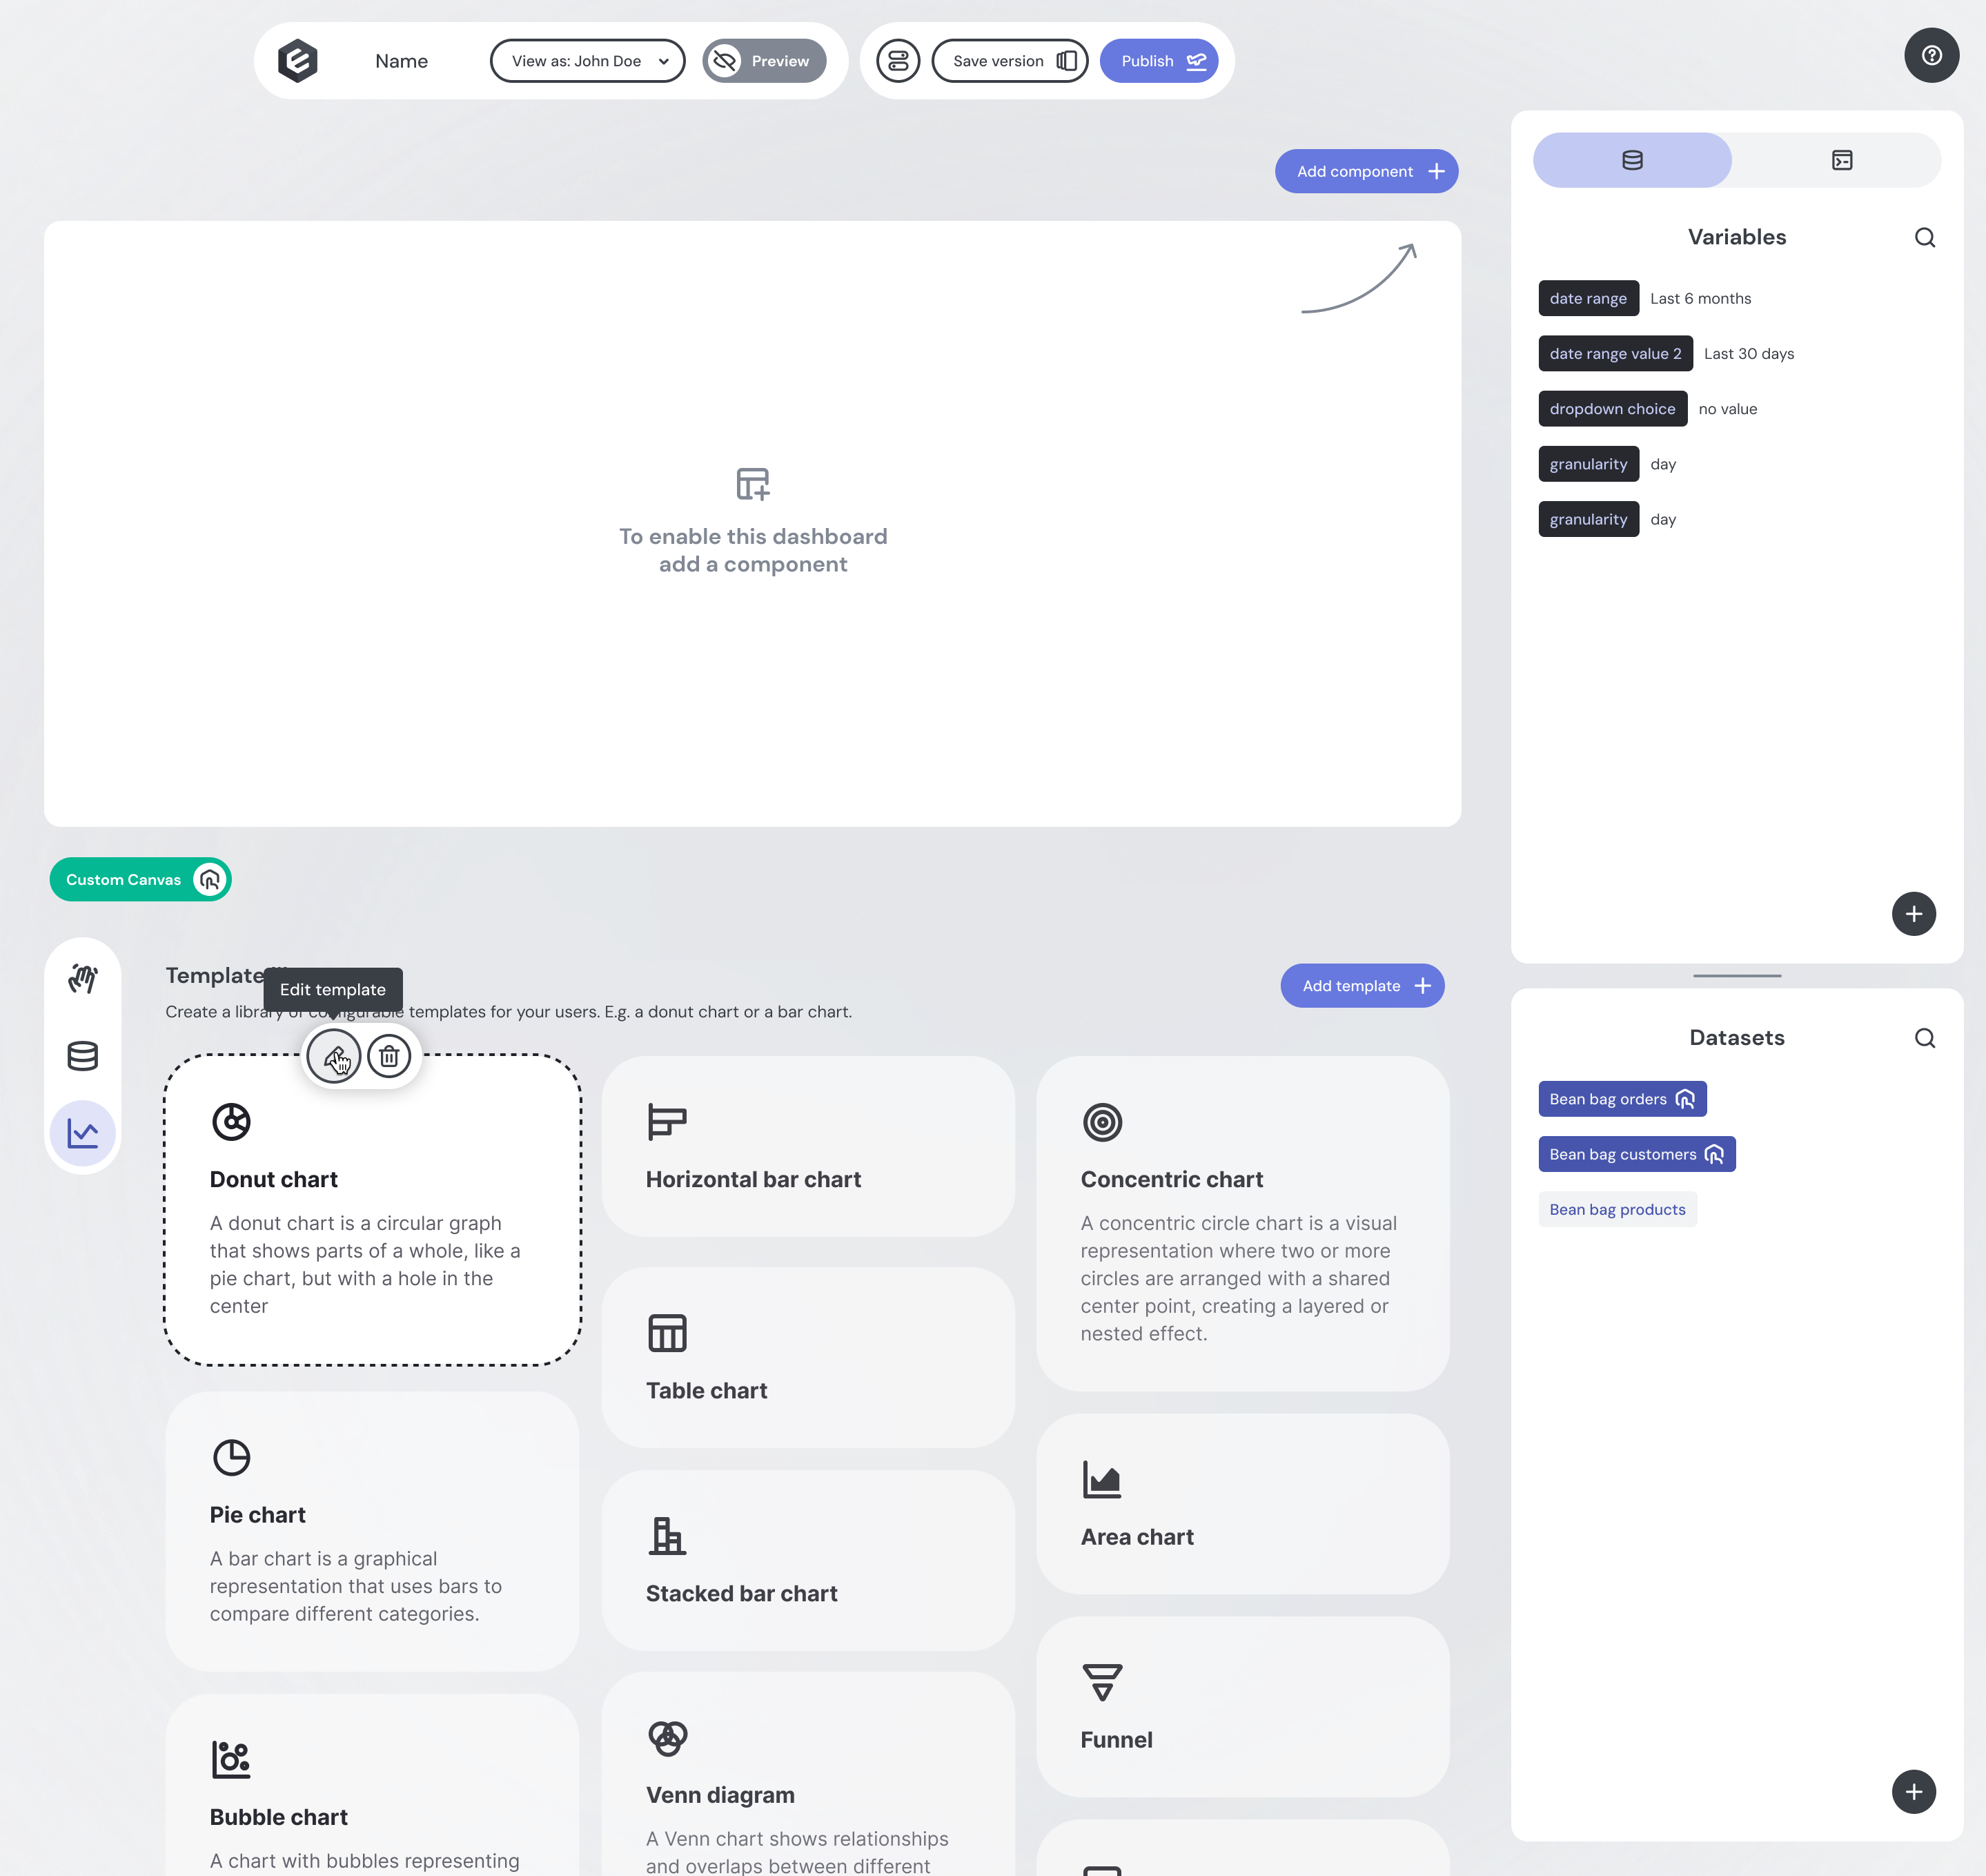
All configured templates appear on your dashboard builder page, below your main dashboard.
- Add as many templates as you like.
- Manage templates easily using the on-hover controls.
Preview and Publish
When you’re ready, Preview the user experience to ensure everything looks and feels right. Then simply hit Publish to make Custom Canvas live for your users.

Deploying Custom Canvas
Now you've built a Custom Canvas and you're ready to go live, learn how to deploy it.