Developer Console
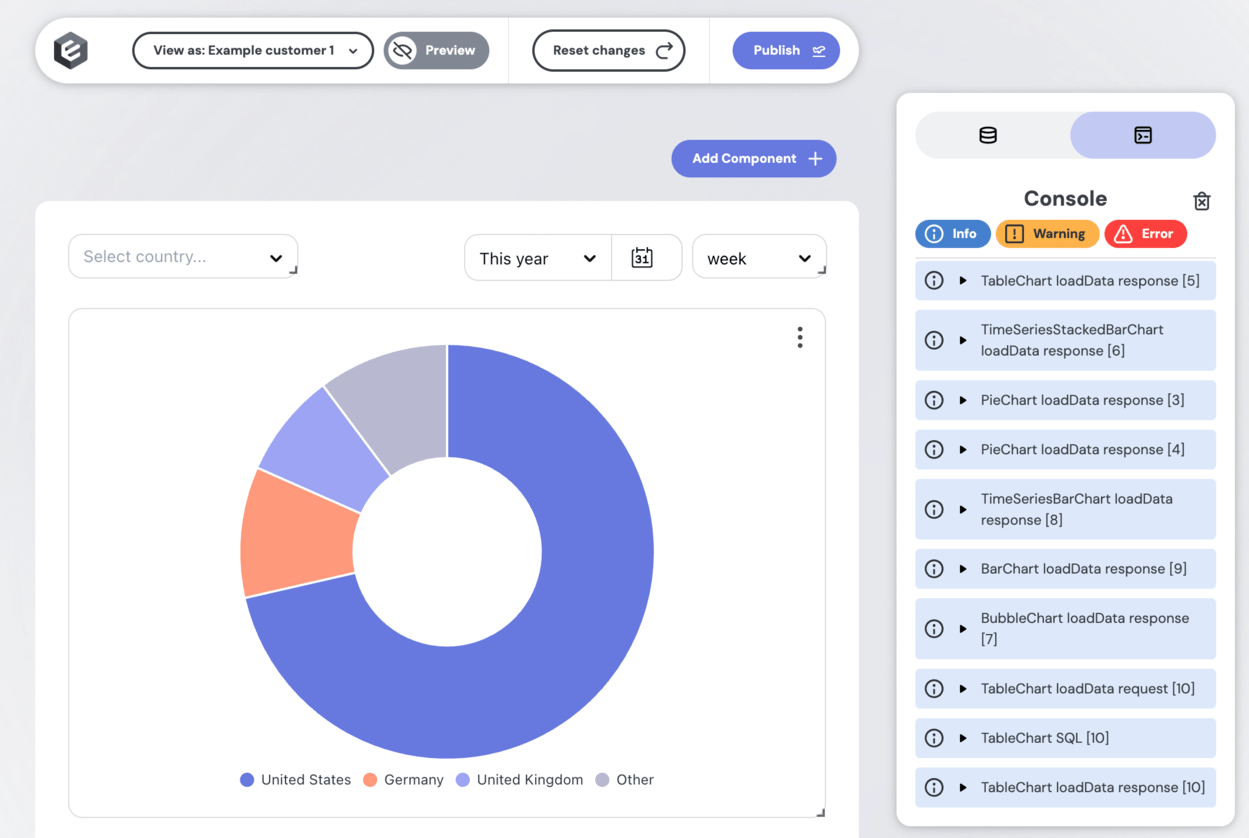
Embeddable provides a developer console that logs the key events and requests occurring inside your dashboard, making it easier to debug or optimize. In this console, you’ll see,
🎥
Learn more about debugging your Embeddable components in our Quick Hits video tutorial on the Debug Button.
1. Info:
loadDataRequest: For each component, shows the parameters passed (dimensions, measures, timeDimensions, etc.).- Generated SQL: The actual query Embeddable forms behind the scenes.
loadDataResponse: For each component, the results returned.- Variable Changes: Whenever a variable updates (e.g. from an event), you’ll see the old value and the new value.
2. Warnings:
- Any caution messages about potential issues—like missing trailing slashes in base URLs or unsupported operators.
- Tells you if loading is blocked by a pre-aggregation being built.
3. Errors:
- Detailed logs of failures (e.g., invalid tokens, network errors, or filter misconfigurations).
The Console is also available when developing locally.