🚀 What’s New in Embeddable
September 2025
We’ve been hard at work improving Embeddable! Here’s a roundup of the latest features and enhancements designed to help you build, manage, and secure dashboards more efficiently.
1. Save dashboard and publish to different environments
You can now save an Embeddable dashboard as a version and publish it to different environments. Publish dashboards to dev, staging, or prod, and even run it all through your CI/CD.
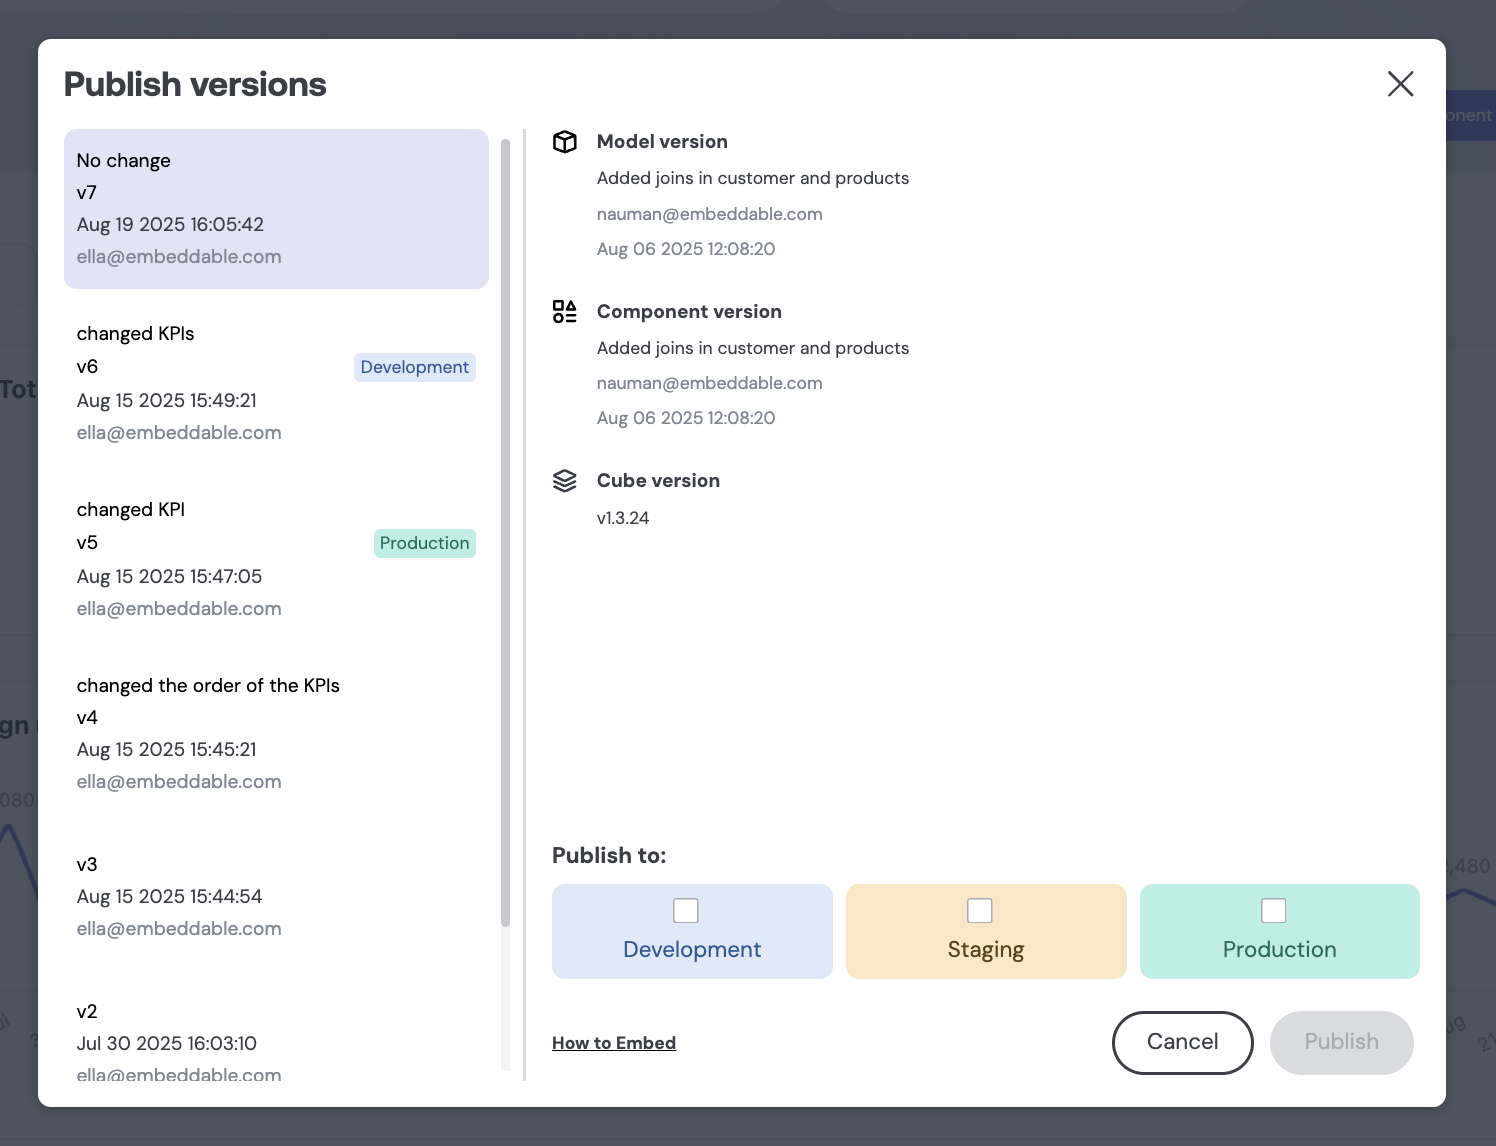
Learn more about Saving versions here, and Publishing dashboards here.
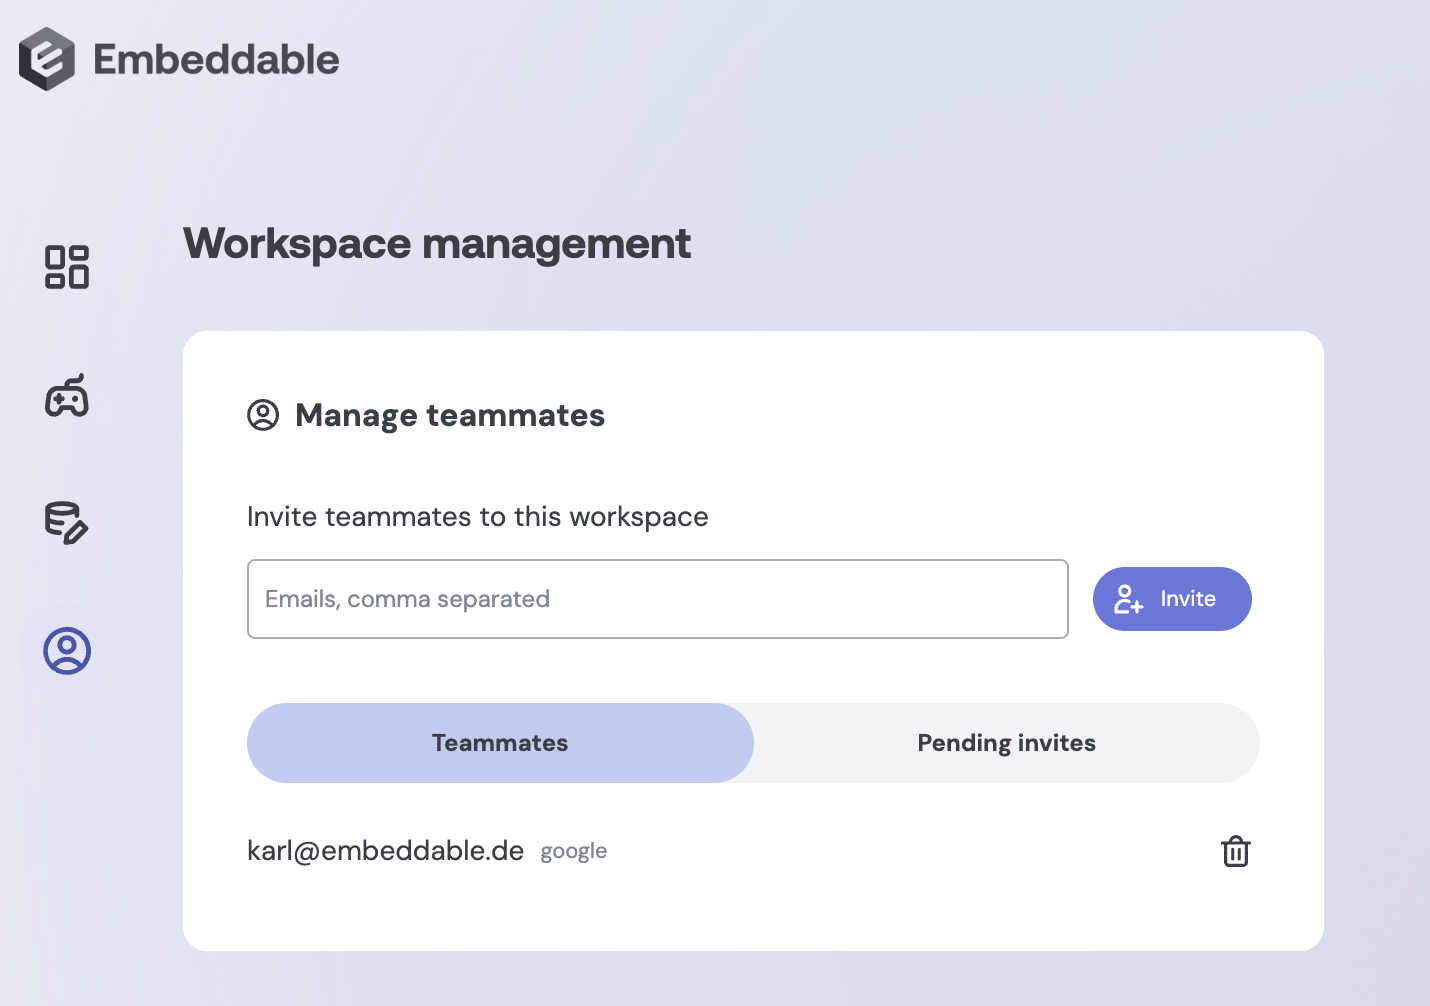
2. Workspace management
Manage team member access to Embeddable workspace under 'Manage team' menu option.
3. Data Access Policies
Access Policies make enforcing row-level security powerful, flexible, and safe. Reusable and applied at runtime, they support nested filters, role-based logic, and automatically guard against SQL injection.
With Access Policies, you can:
- Assign multiple roles per user without complex SQL workarounds
- Apply conditional rules (e.g., only for admin users) easily
- Build complex nested filters (AND/OR combinations) in a maintainable way
- Automatically handle user-provided values safely, protecting against SQL injection
We continue to support traditional SQL-based RLS, but Access Policies make it easier to manage security at scale.
Learn more about Data Access Policies here.
4. Point at different Cube deployments
Embeddable now lets you connect to multiple Cube deployments — either staging/preview branches or completely separate deployments — so you can test changes safely, manage different environments, and switch between data providers in the builder.
Learn more about Multiple Cube deployments here.
5. Timezone support
You can now set a specific timezone for Embeddable dashboards.
This ensures all users see data in a consistent “reporting timezone,” avoiding confusion from browser-based timezones and supporting accurate aggregations across global teams.
- Pass a standard timezone string in clientContext and loadData for timezone-aware queries
- Default timezone remains UTC for backwards compatibility and omitted values
- Handles timezones globally, including daylight saving changes
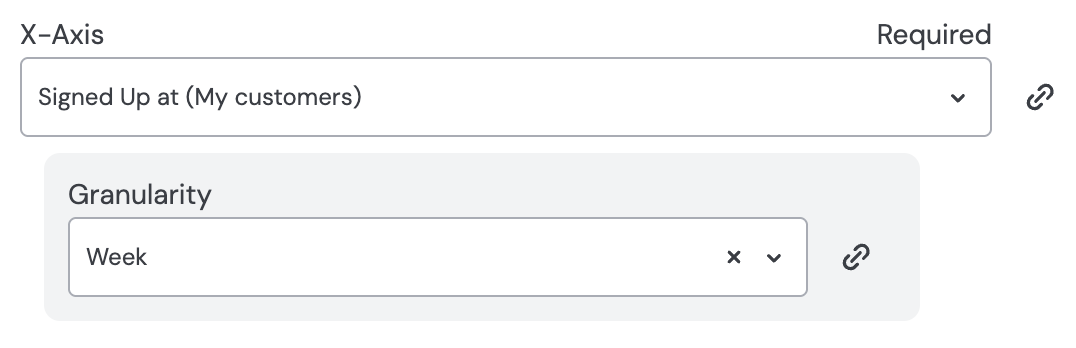
6. Time granularity when choosing a time dimension
Pick a time dimension and select granularity (second, minute, hour, day, week, month, quarter, year). Works in the chart builder or in data playground.
July 2025
In the last months we shipped several updates to make building and managing dashboards more intuitive and flexible. From improvements to the data modeling experience to new ways to configure inputs and control versioning, here’s a quick look at what’s new.
1. Data Model Editor
You can now create and edit data models directly in Embeddable.
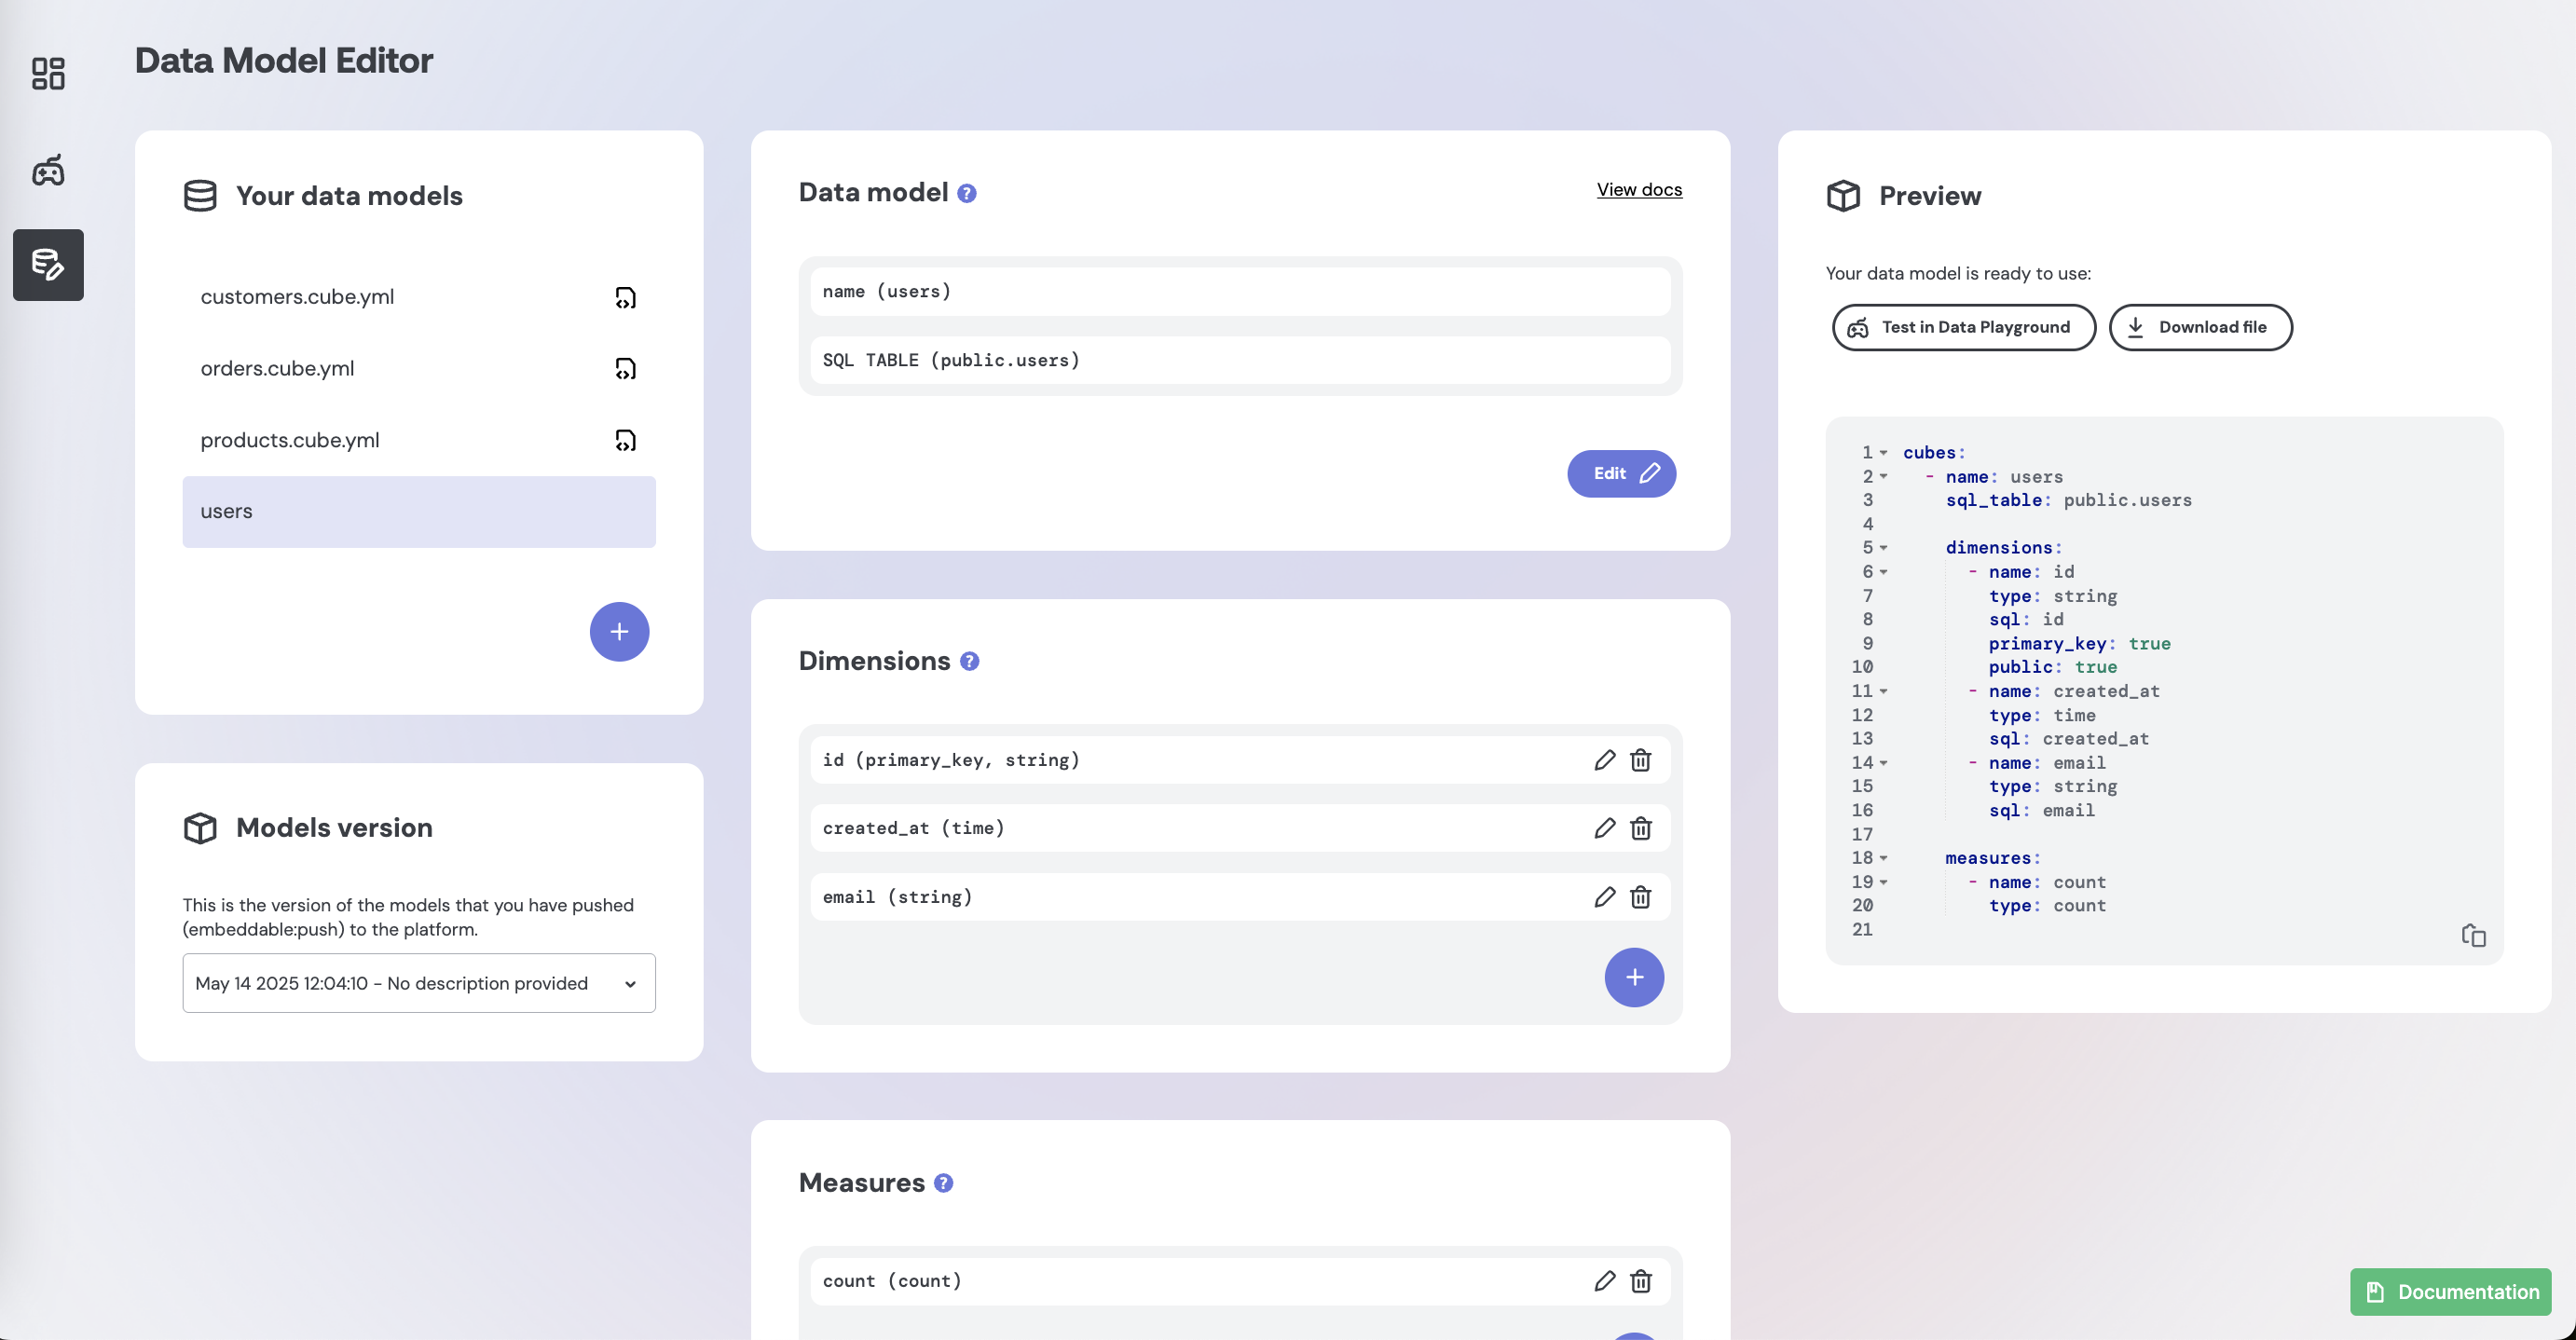
Why it matters:
This makes it easier to define models and build dashboards faster, especially for teams getting started.
What’s new:
- Create, edit, and delete no-code models
- View read-only previews of code-managed models
- Visual editing for models, joins, dimensions, and measures
- Inline YAML preview with copy/download
Learn more about Data Model Editor here.
2. Cube Version Picker
Control exactly which Cube.js version your dashboards use.
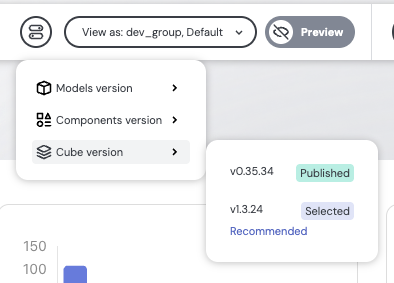
Why it matters:
Test safely before going live and avoid breaking changes from upstream Cube updates.
What’s new:
- New "Cube version" picker in Builder and Playground
- Default is latest, but you can switch freely
- Live embeddables only update after you publish with a selected version
3. Sub Inputs for Dimensions & Measures
You can now define custom sub inputs per dimension or measure in chart configurations.
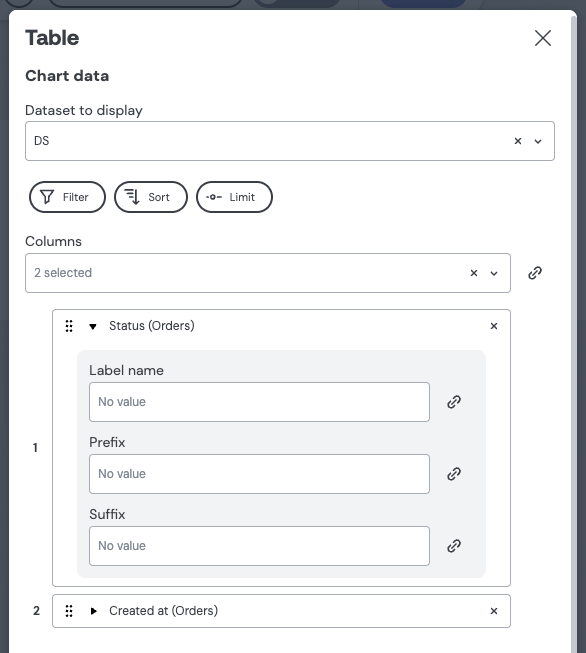
Why it matters:
Allows specifying a number of additional settings (e.g. title / granularity / rounding / etc.) per dimension or measure in components.
examples:
- Add a prefix/suffix to string fields
- Customize date formatting for time fields
- Rename columns with user-friendly labels
Learn more about Sub Inputs for Dimensions & Measures here
4. Dimension & Measure Variables
You can now use dimensions and measures as variables and link them directly as inputs to dashboard components.
Why it matters:
A popular feature that teams want to be able to implement is the ability to allow end-users to dynamically change the measures or dimensions that are being shown on a dashboard. E.g. you could have a dropdown containing a list of dimensions or measures, and then when users switch to another dimension or measure, all the charts update to show that dimension or measure. This is now easy to do in Embeddable.
What’s new:
- New variable types: “Dimension”, “Measure”, and “Dimension or Measure” available in the variable type dropdown.
- Select from all available dimensions or measures across your models, with support for single or multi-select.
- Easily link these variables as inputs to components, just like other variable types.
Learn more about Dimensions & Measures as variables here
5. In-App AI Support (Powered by Inkeep)
We’ve added an AI assistant across the platform so you can get help instantly—without leaving the app.
Why it matters:
Search across docs, FAQs, roadmap, and changelogs without needing to message us.
What’s new:
- ‘Ask AI’ button in the top-right corner of the Embeddable platform, or bottom-right in the documentation
- AI pulls answers from all support content