Tutorial: Zero to Dashboard in 25 Minutes
Here is a complete guide for getting started with Embeddable. We'll take you through all the steps necessary to go from a bare workspace, to embedding a dashboard into your application that uses your data.
Contents
- 00:00 (opens in a new tab) Intro
- 00:21 (opens in a new tab) Step 1: Getting Started
- 03:00 (opens in a new tab) Step 2: Create Your Database Connection
- 04:48 (opens in a new tab) Step 3: Test Your Database Connection
- 06:45 (opens in a new tab) Step 4: Build a Data Model
- 09:24 (opens in a new tab) Step 5: Publish the Data Model
- 11:45 (opens in a new tab) Step 6: Apply Row-Level Security
- 14:37 (opens in a new tab) Step 7: Build a Dashboard
- 21:00 (opens in a new tab) Step 8: Embed Your Dashboard
Introduction
Welcome to our complete overview on getting started with Embeddable! While you can find all of this info (and more!) in our documentation, we want to go through all the steps necessary to go from signing up to publishing a live dashboard that displays your own data. We’ll take you through everything you need: creating database connections, adding data models, wiring up components, and embedding your dashboard.
Step 1 - Getting Started
The first thing you’ll need is an Embeddable workspace. You should already have one of those, if you’ve signed up, but if you’re watching this video ahead of that step, please reach out and we’ll get you set up and generate a workspace to hold your dashboards.
We’re going to use Embeddable’s handy Command Line Tool to set up and populate our workspace, but our documentation fully covers the manual approach. In either case, you’ll end up with a functioning workspace and a folder containing all of the code you’ll need to get a dashboard set up.
You’ll need Node.js (opens in a new tab) installed on your computer to run the command line tool. We recommend the latest Long Term Stable version, but you’ll need at least version 22 to run our build tools.
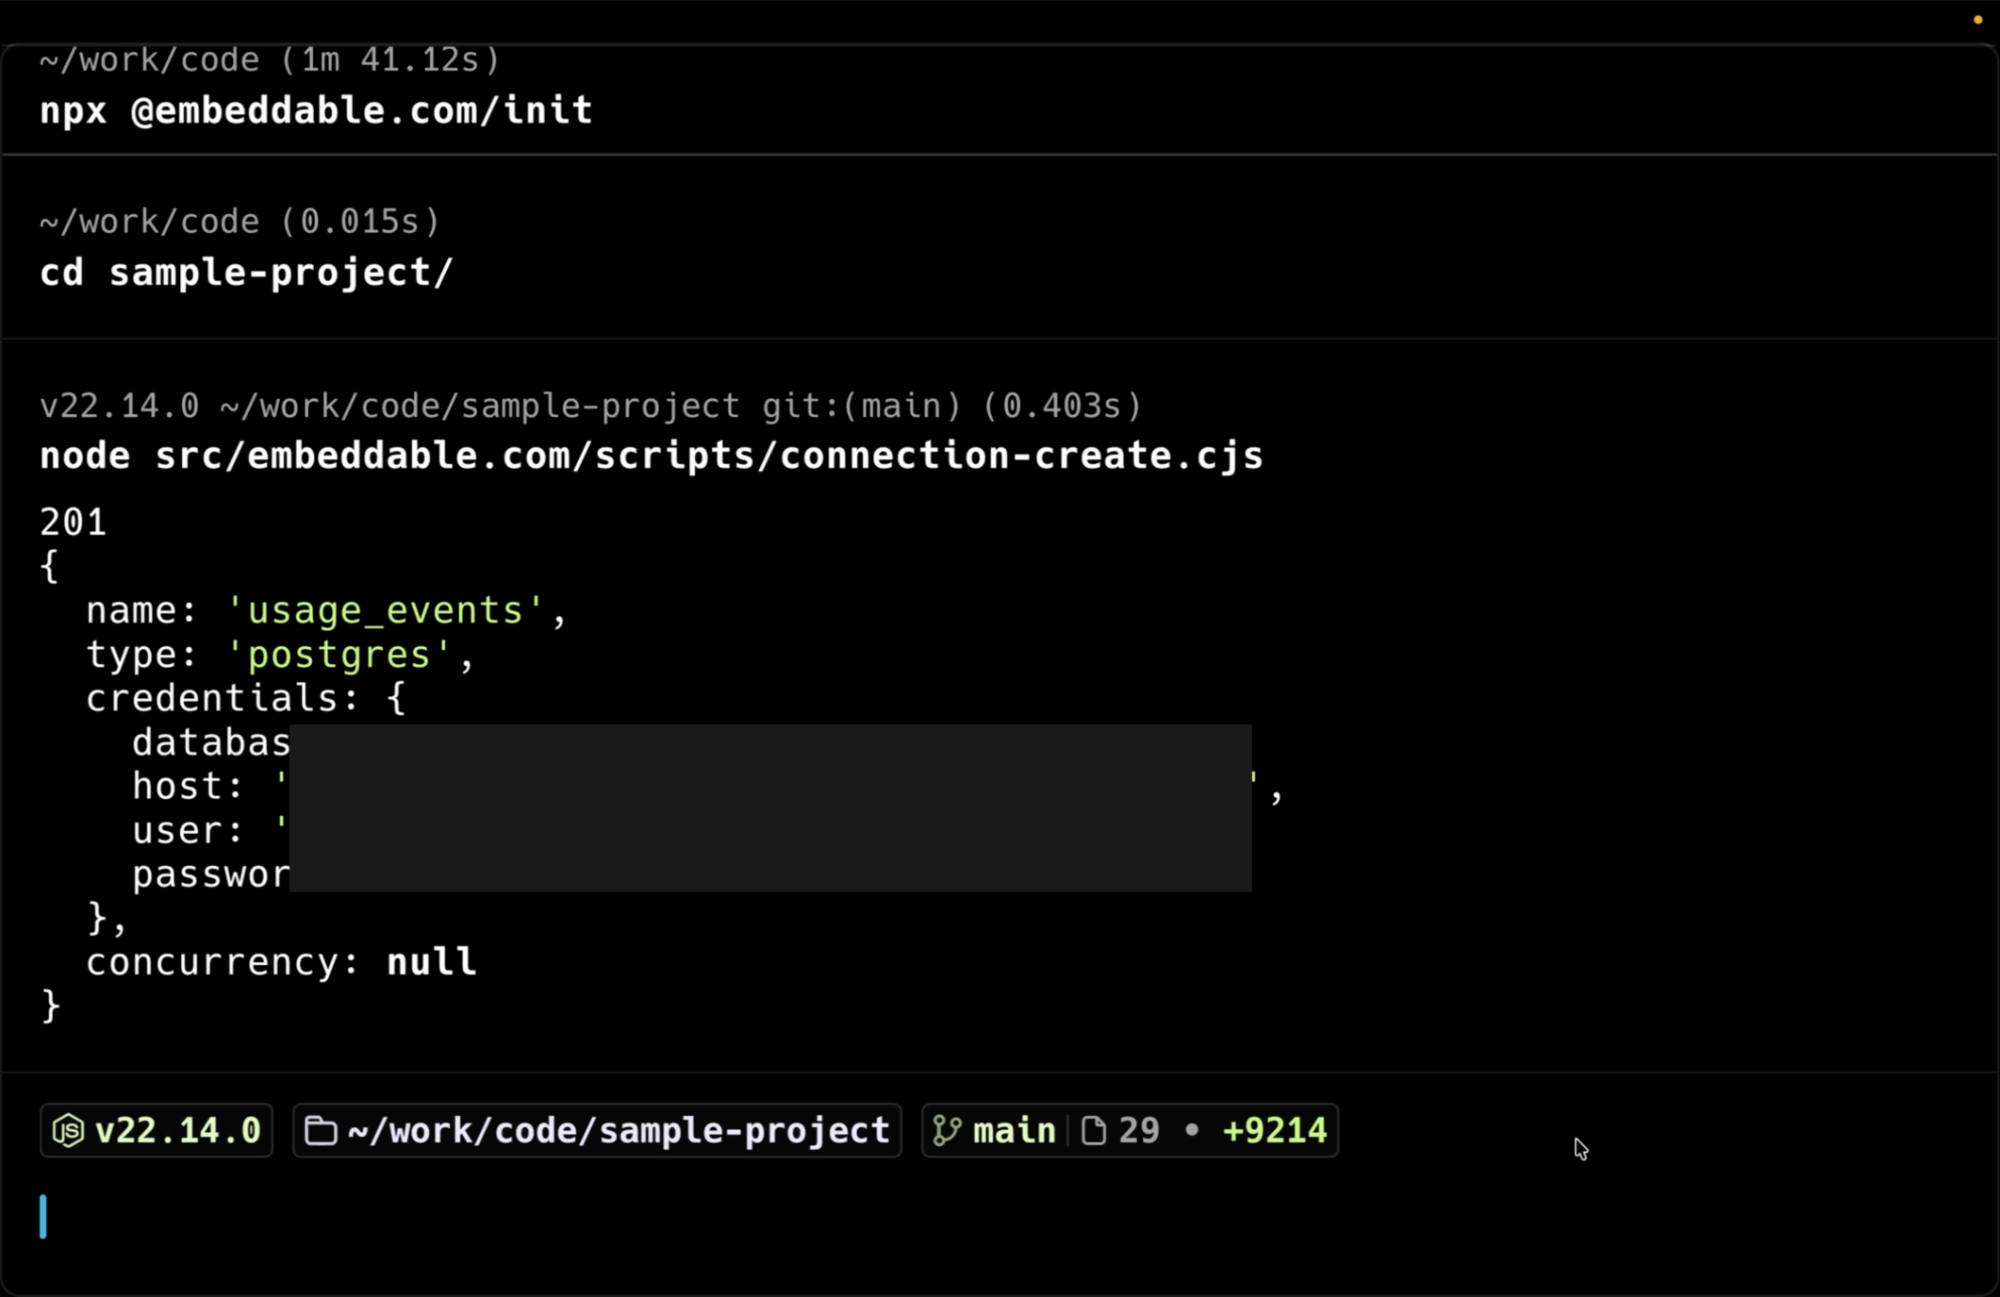
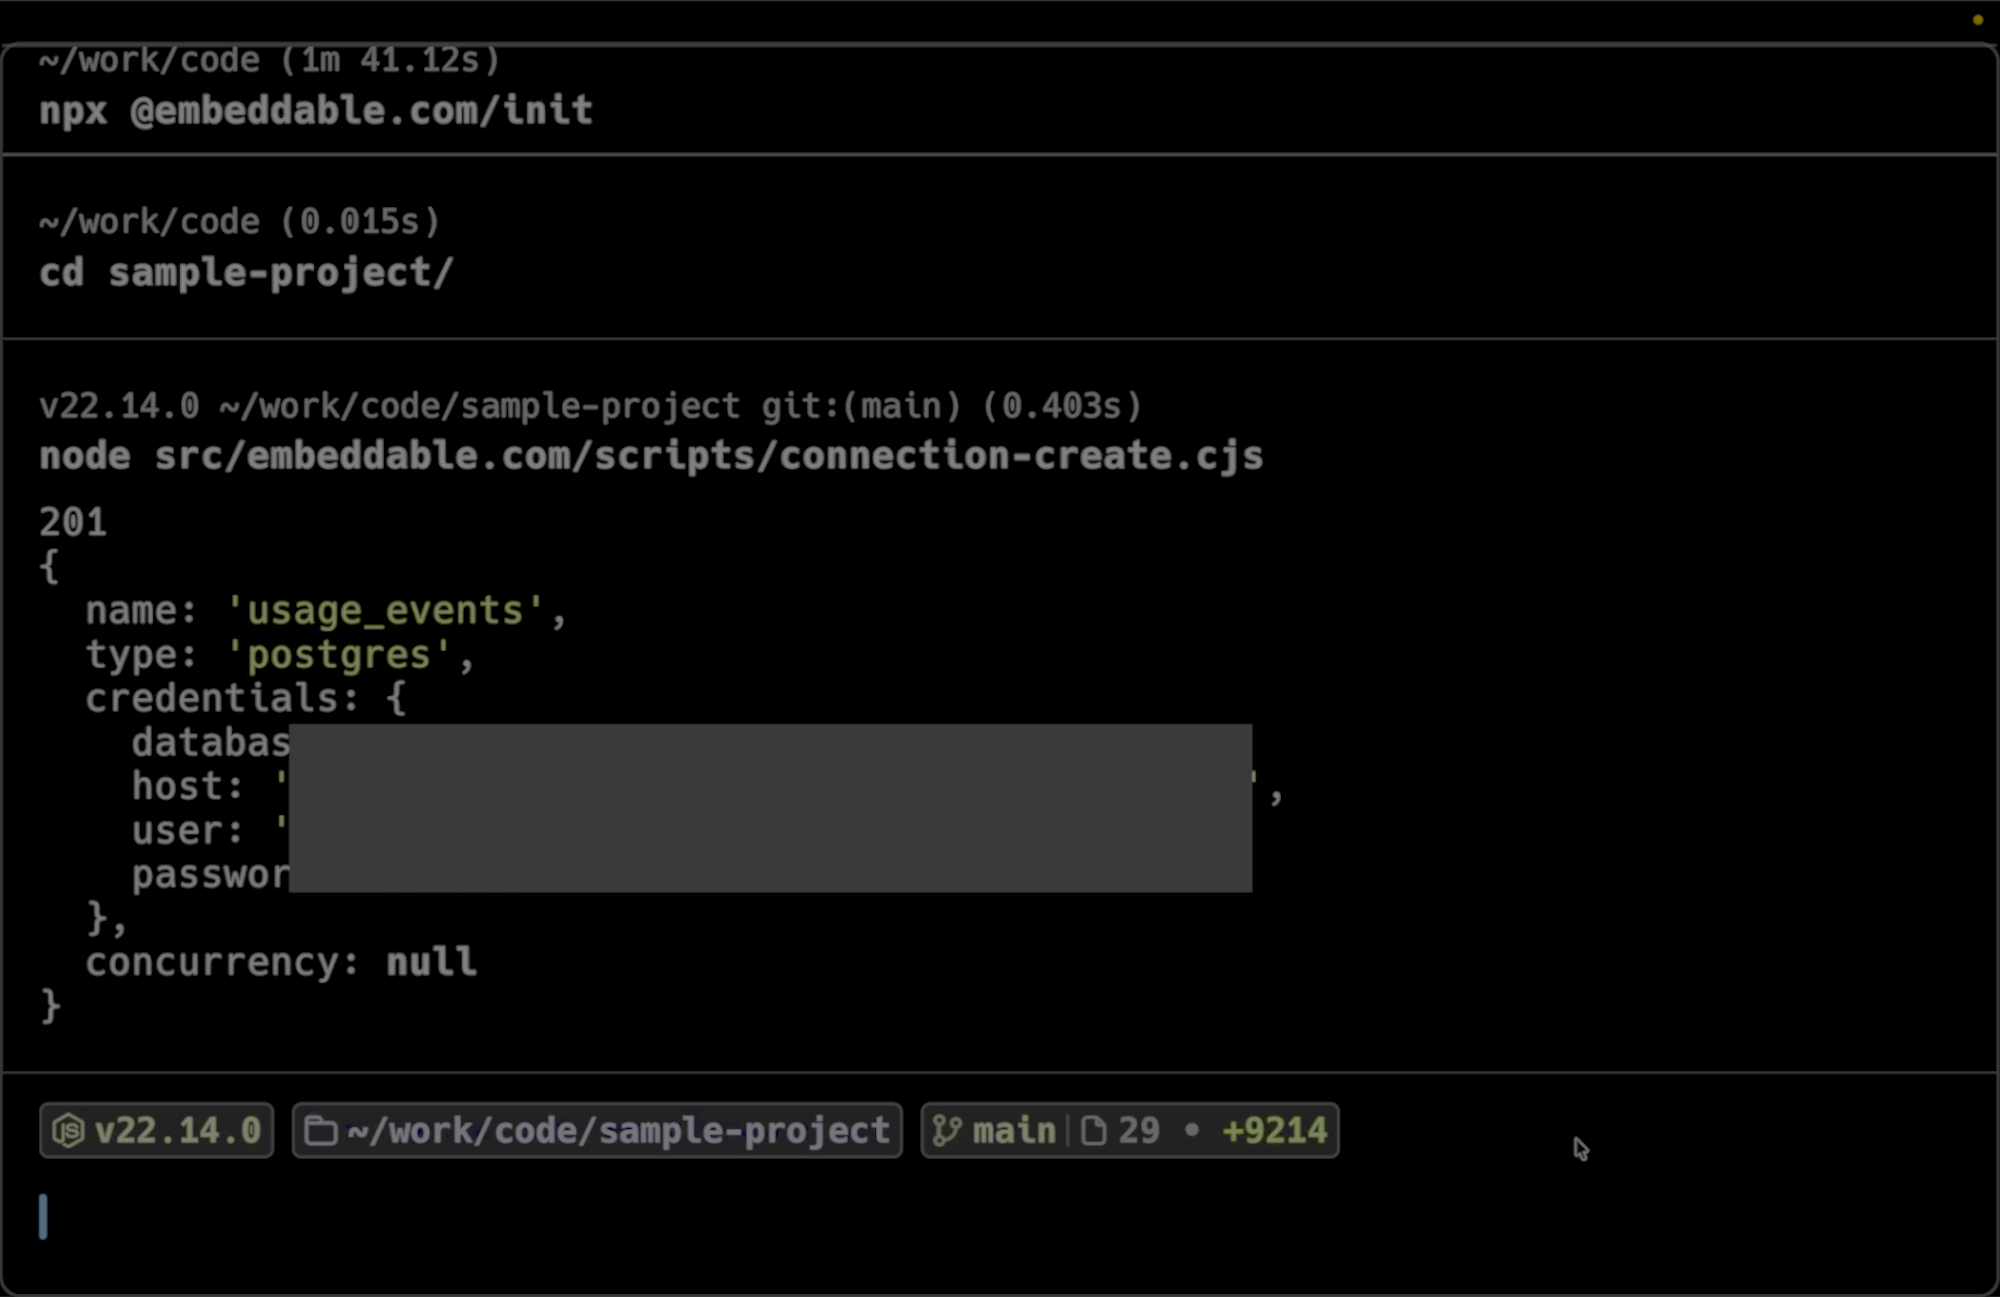
Open a terminal or command prompt. cd to wherever it is you keep your code repositories, and type npx @embeddable.com/init and hit enter. You’ll be prompted to install the latest version of our init package, so answer yes, and then give it permission to create a new folder. The next step is naming the folder. For this tutorial we’re going with sample-project but you should use something relevant to your particular application.
The next thing it needs is an API key. You can find that on your workspace’s main page. Copy and paste it in. Then confirm your region. This will kick off the build process, which will copy our boilerplate into the folder you specified, build it, and publish it to your workspace. As you’ll see from the success message, this also pushes our default chart library (Remarkable Pro (opens in a new tab)) and sample models to the workspace, and will create two sample dashboards as well (you can see those if you refresh the workspace).
It’ll also open a browser page with some more information for you to check out. We’re going to skip that for this tutorial. You can cd into your sample-project folder. You may also want to add it to your code editor of choice.
From here, we recommend taking a break from this tutorial and playing around with your new workspace! Take a look at the sample dashboards, maybe make some changes, and get a feel for the application. Don’t worry, though, if you want to continue right away, we’re going to talk you through everything.
Step 2 - Create Your Database Connection
Spotify data is fun to play with and all, but you’re probably wondering how you connect to your database and make that data usable? In this and the following steps, we’ll show you how. We’ll connect to your database using the Connections API. We’ll test the connection using both a script and API clients like Postman and Bruno. We’ll generate a data model using Embeddable’s AI Model Builder or manually. Finally we’ll apply Row Level Security so data is securely filtered.
Let’s start by connecting our database. In Embeddable, a connection defines how we securely talk to an external database. We’ll create one using the Connections API. This example uses a PostgreSQL database, but the same pattern applies to other supported databases (opens in a new tab).
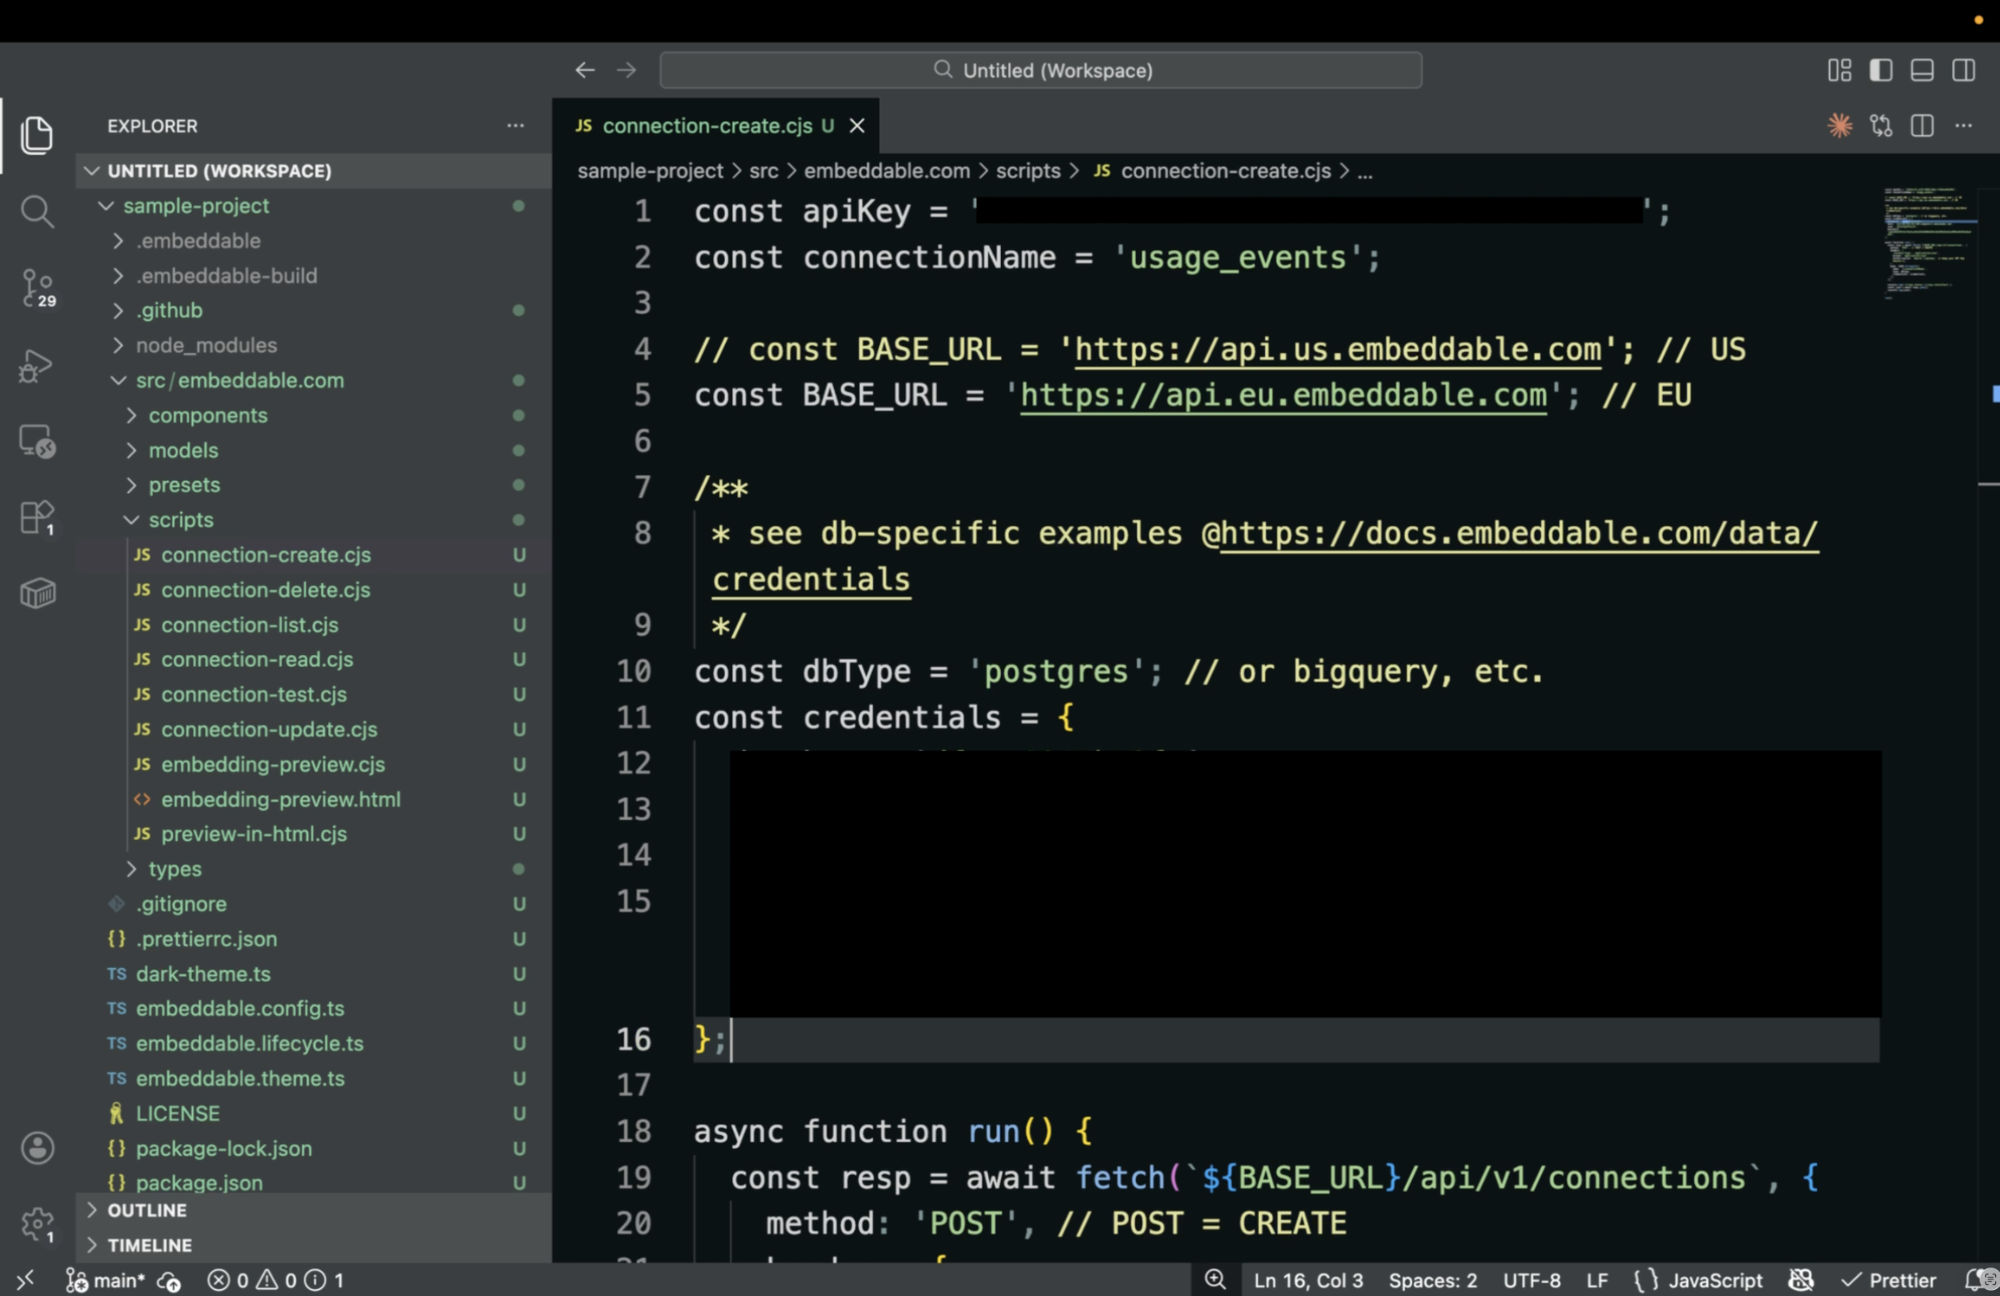
To create a connection, we’re not writing a custom back-end from scratch. Inside the Embeddable repository, we already provide reusable scripts that interact with the Connections API. These scripts live under src/embeddable.com/scripts and allow you to create, list, update, test, and delete connections.
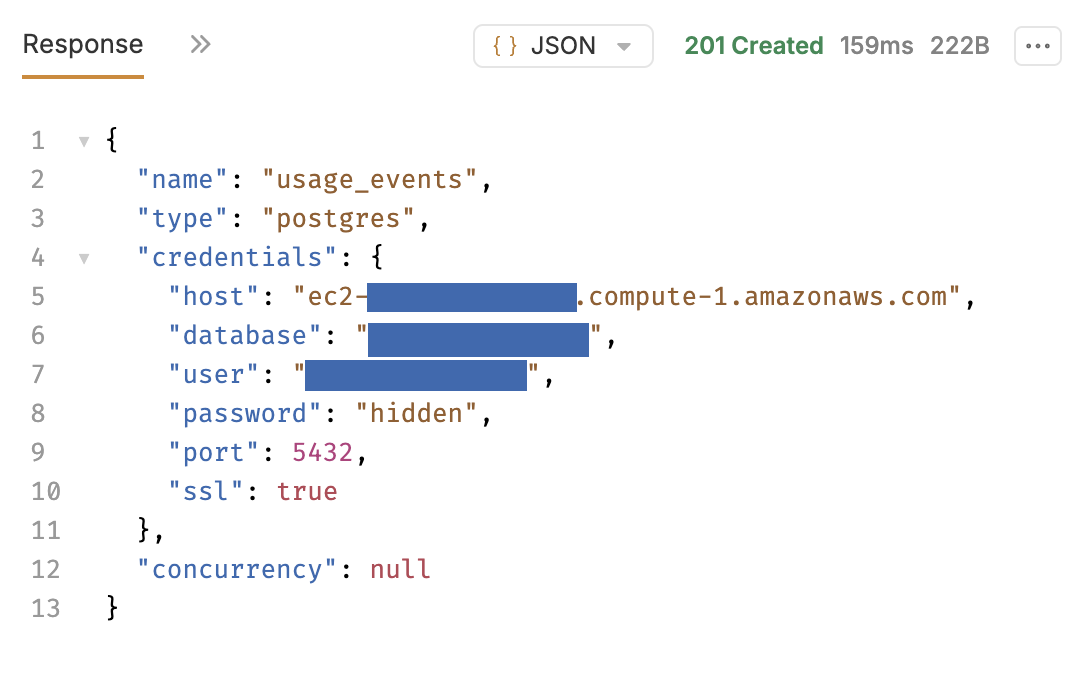
To create a connection, we’ll use connection-create.cjs. In this file, we update the database credentials for our PostgreSQL database - things like the host, database name, user, and password. We also have to provide a connection name and our API key, which is found in our workspace. We’ve redacted the details for this video, of course!
Important Note: you only need to create this connection one time per database. Once it exists, Embeddable stores it and uses it to connect to your DB as needed. You can specify which tables to connect to in your models. You only need more than one connection if you have more than one database.**
Once we’ve added everything we need, we can save the file and run the script with node src/embeddable.com/scripts/connection-create.cjs, and it will respond with a 200 indicating that the connection’s created. This doesn’t mean it works though, we’ll need to test it for that!
Step 3 - Test Your Database Connection
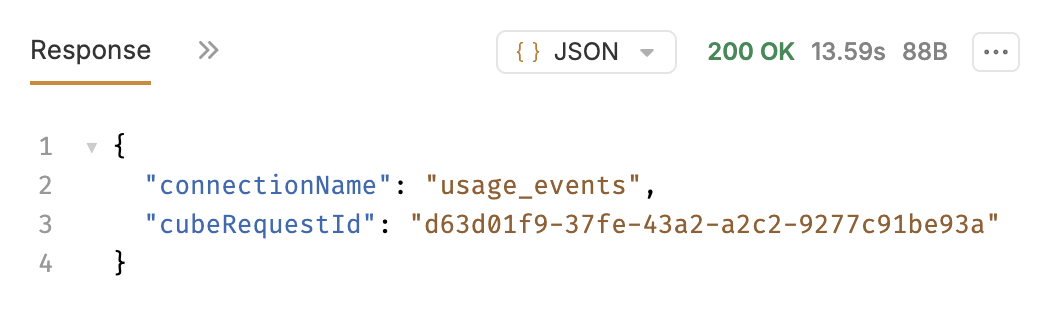
Creating the connection is only the first step. We also want to make sure Embeddable can actually connect to your database. For that, we’ll use connection-test.cjs. In this script, we’ll provide our API key again, and the connection name we just created. Save that, and run the test script with node src/embeddable.com/scripts/connection-test.cjs. A successful response confirms that Embeddable can reach the database and authenticate correctly. Having trouble at this point? Don’t hesitate to reach out to our Customer Success team for help!
You can also test the connections API with Bruno and Postman. Everything we just did using scripts can also be done manually using API clients. This is useful for exploration, debugging, or just understanding how the API works. Let’s take a quick look:
Bruno
All of Embeddable’s public APIs are available in a GitHub repository (opens in a new tab). Once you clone the repository, you can open it directly in Bruno. From there, you’ll need to set a few environment values: the region and the API key. With that done, we can start calling the Connections API endpoints.
First, we’ll use the list connections endpoint. This lets us confirm that the connection we created earlier using the script is visible. The create connection endpoint here expects the same database credentials we provided in the script. If needed, we can delete the existing connection and recreate it directly from Bruno.
Finally, we’ll call the test connection endpoint to verify that everything is working as expected.
Postman
Postman works in exactly the same way as Bruno, just without the repo from GitHub. To create a connection in Postman, you’ll need to define everything manually, but it’s very straightforward. You’ll need a connection name, your API key, and your database credentials. Once you’ve added that information, you can send the POST request to the appropriate API endpoint, and the connection will be created, just like with the script.
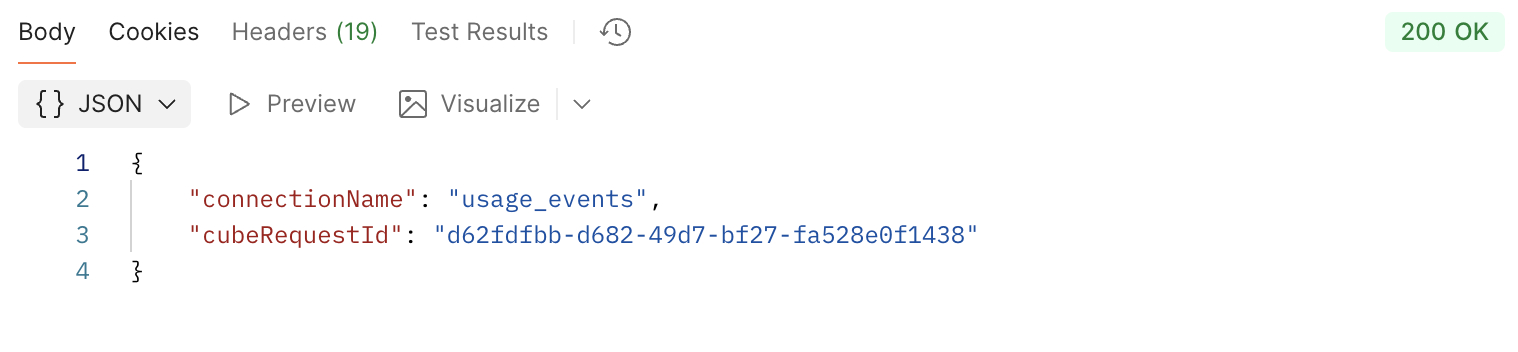
It’s the same process to test a connection. Just create a call to the test endpoint, give it your connection name and API key, and run the request. It should show a success message.
Step 4 - Build a Data Model
Let’s take a second to understand the data we’re going to be modeling. Now that the database is connected, let’s look at the data we want to expose. In our database, we have a table called usage_events_daily. It was created like this:
create table public.usage_events_daily (
  id bigserial primary key,
  client_id int not null,
  event_date date not null,
  event_name text not null,
  users_count int not null,
  events_count int not null
);
This table stores daily usage metrics. The client_id column represents a tenant or account, and we’ll use that later when we apply Row Level Security.
Even though the database is connected, Embeddable still doesn’t know how to query this data. That’s where data models come in. Data models are a core part of your semantic layer. This is where you define your dimensions, measures, and how different models relate to each other through joins.
To help with this, Embeddable provides an AI Model Builder.** This builder is designed to assist you while building models*, *****not to automatically generate an entire semantic layer from your whole database. Typically you’d use it table by table or query by query. It helps you understand how to structure dimensions, measures, and model definitions based on your schema or SQL.
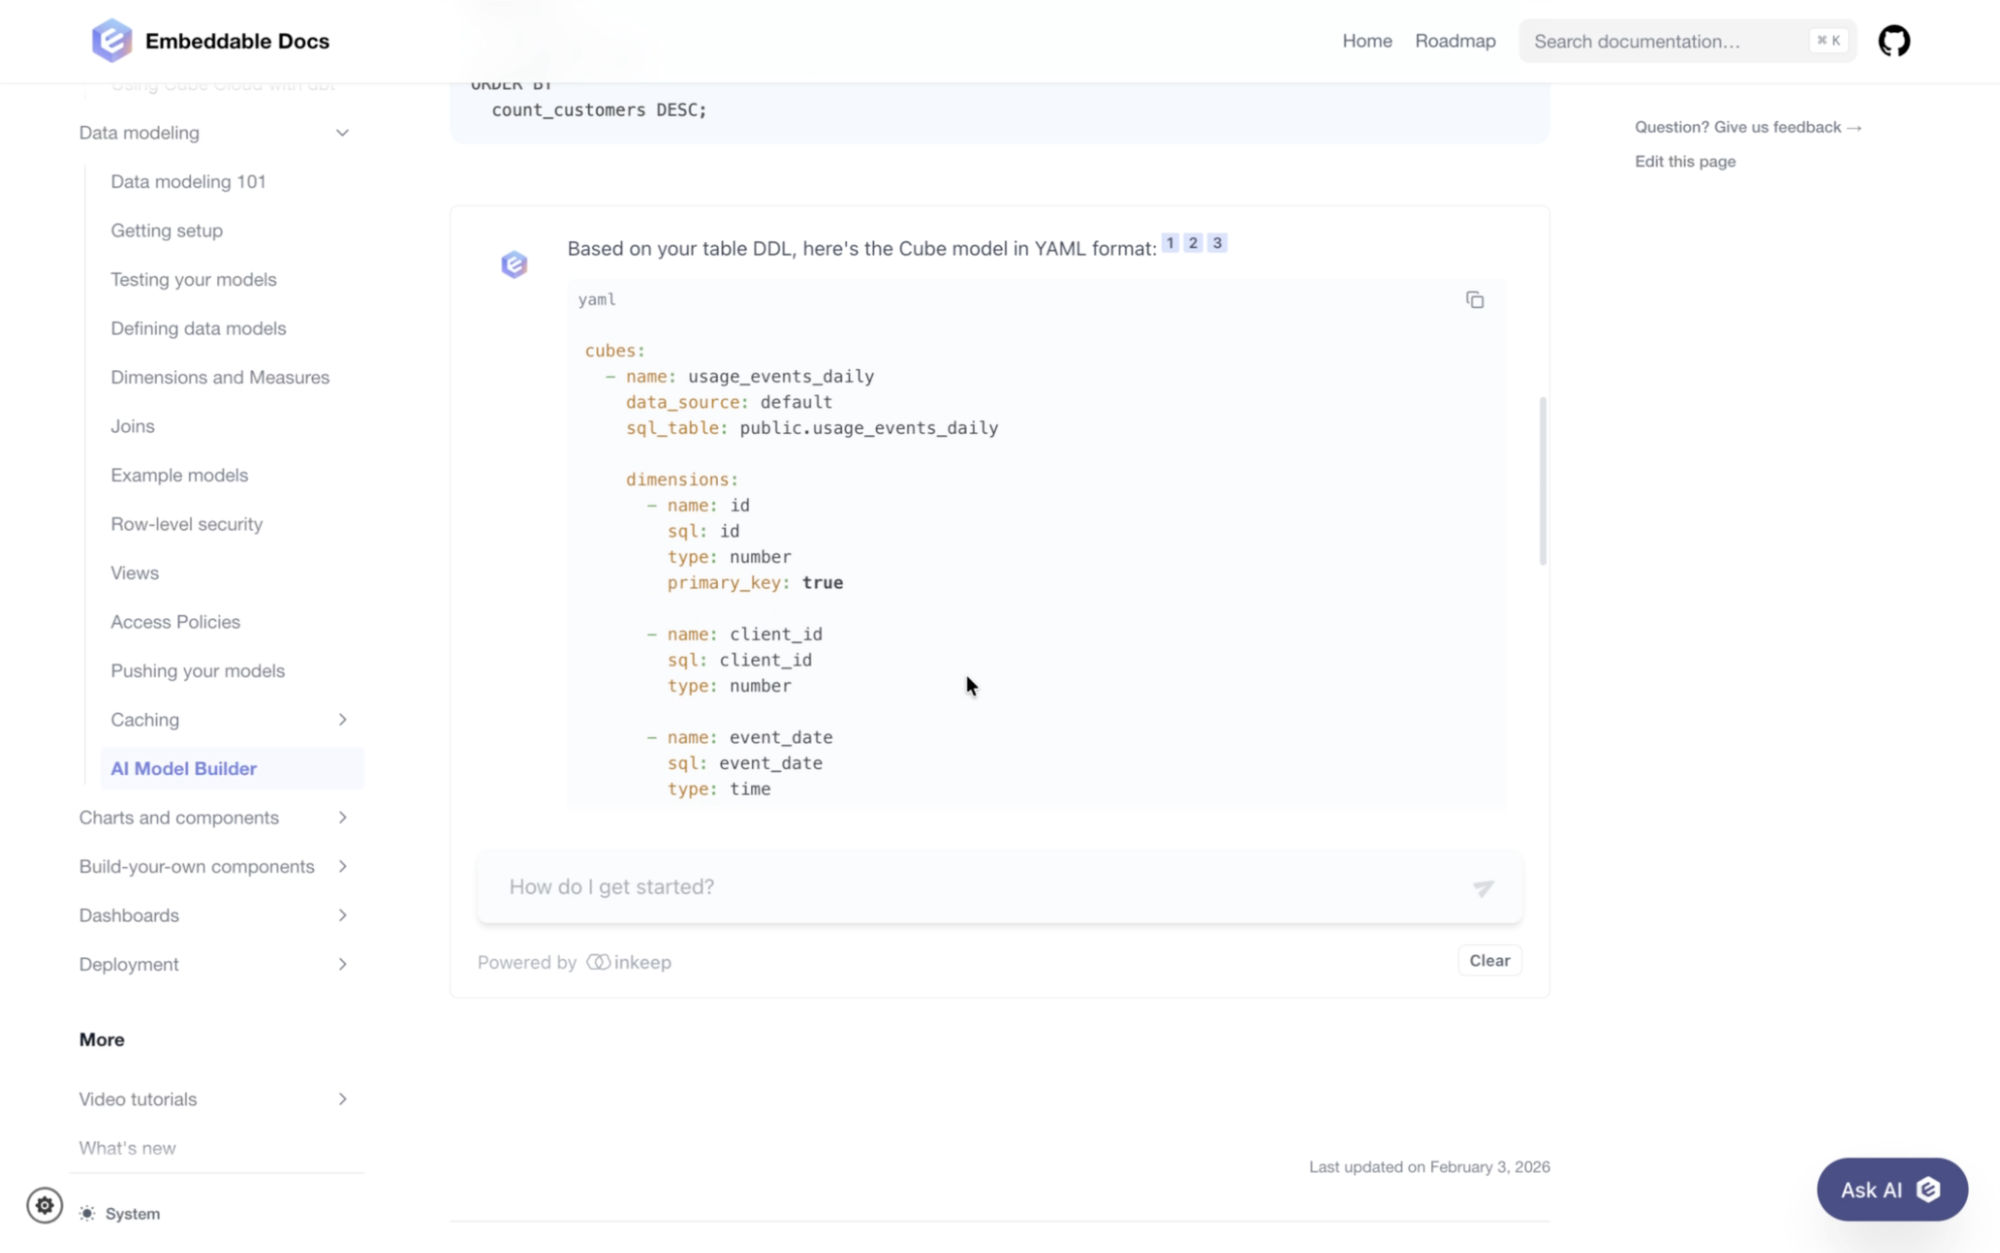
To use the AI model builder, you can provide a table definition, DDL, or SQL query, and the output format you want. In this case, we want YAML. Over time, you can continue using the AI helper while expanding and refining your models. Here, we’re going to give the model builder the following instructions:
Dimensions: id, client_id, event_date, event_name
Measures: count (title: "# of Records", type: count)
Primary Key: id
Output format: YAML.
---
create table public.usage_events_daily (
  id bigserial primary key,
  client_id int not null,
  event_date date not null,
  event_name text not null,
  users_count int not null,
  events_count int not null
);
Here you can see the generated model:
cubes:
  - name: usage_events_daily
    data_source: default
    sql_table: public.usage_events_daily

    dimensions:
      - name: id
        sql: id
        type: number
        primary_key: true

      - name: client_id
        sql: client_id
        type: number

      - name: event_date
        sql: event_date
        type: time

      - name: event_name
        sql: event_name
        type: string

    measures:
      - name: count
        type: count
        title: "# of Records"
You’ll want to save this file to src/embeddable.com/models/cubes/usage_events_daily.cube.yml (with a filename that matches your own model). The .cube is important! Embeddable looks for those files specifically.
This model tells Embeddable three important things: which table to query, which fields are dimensions, and which fields are measures. Dimensions are the fields you use to group or filter data - things like dates, names, or IDs. Here that includes event_date, event_name, and client_id. Measures are the fields you aggregate - values you count, sum, or average. In this case, we’re defining a simple count of records to measure usage volume.
What we’re really building here is a semantic layer that sits between your raw database and your dashboards. It defines metrics, dimensions, and security rules in one central place.
Embeddable uses Cube under the hood to power this semantic layer, ensuring that every dashboard uses the same consistent business logic.
Step 5 - Publish the Data Model
Once the model looks good to go, the next step is to push it to Embeddable. To do that, we go back to our Embeddable repository and run a few commands. First, we log into the Embeddable with npm run embeddable:login. This authenticates the CLI with your Embeddable workspace. Next, we build the repository with npm run embeddable:build. This validates and prepares our models. We’ll also use this step for components, later. Finally, we push everything to our workspace with npm run embeddable:push. Once this completes, the data model becomes available inside Embeddable and can be used immediately.
No-Code Models in the Embeddable UI
You can also create data models directly from the Embeddable UI using no-code models, which is useful for faster iteration. In the Data Model Editor, click the plus icon to create a new model. From there, you provide a model name, a table name, and the data source. This generates a basic model, and you can then add dimensions and measures directly from the Embeddable Platform.
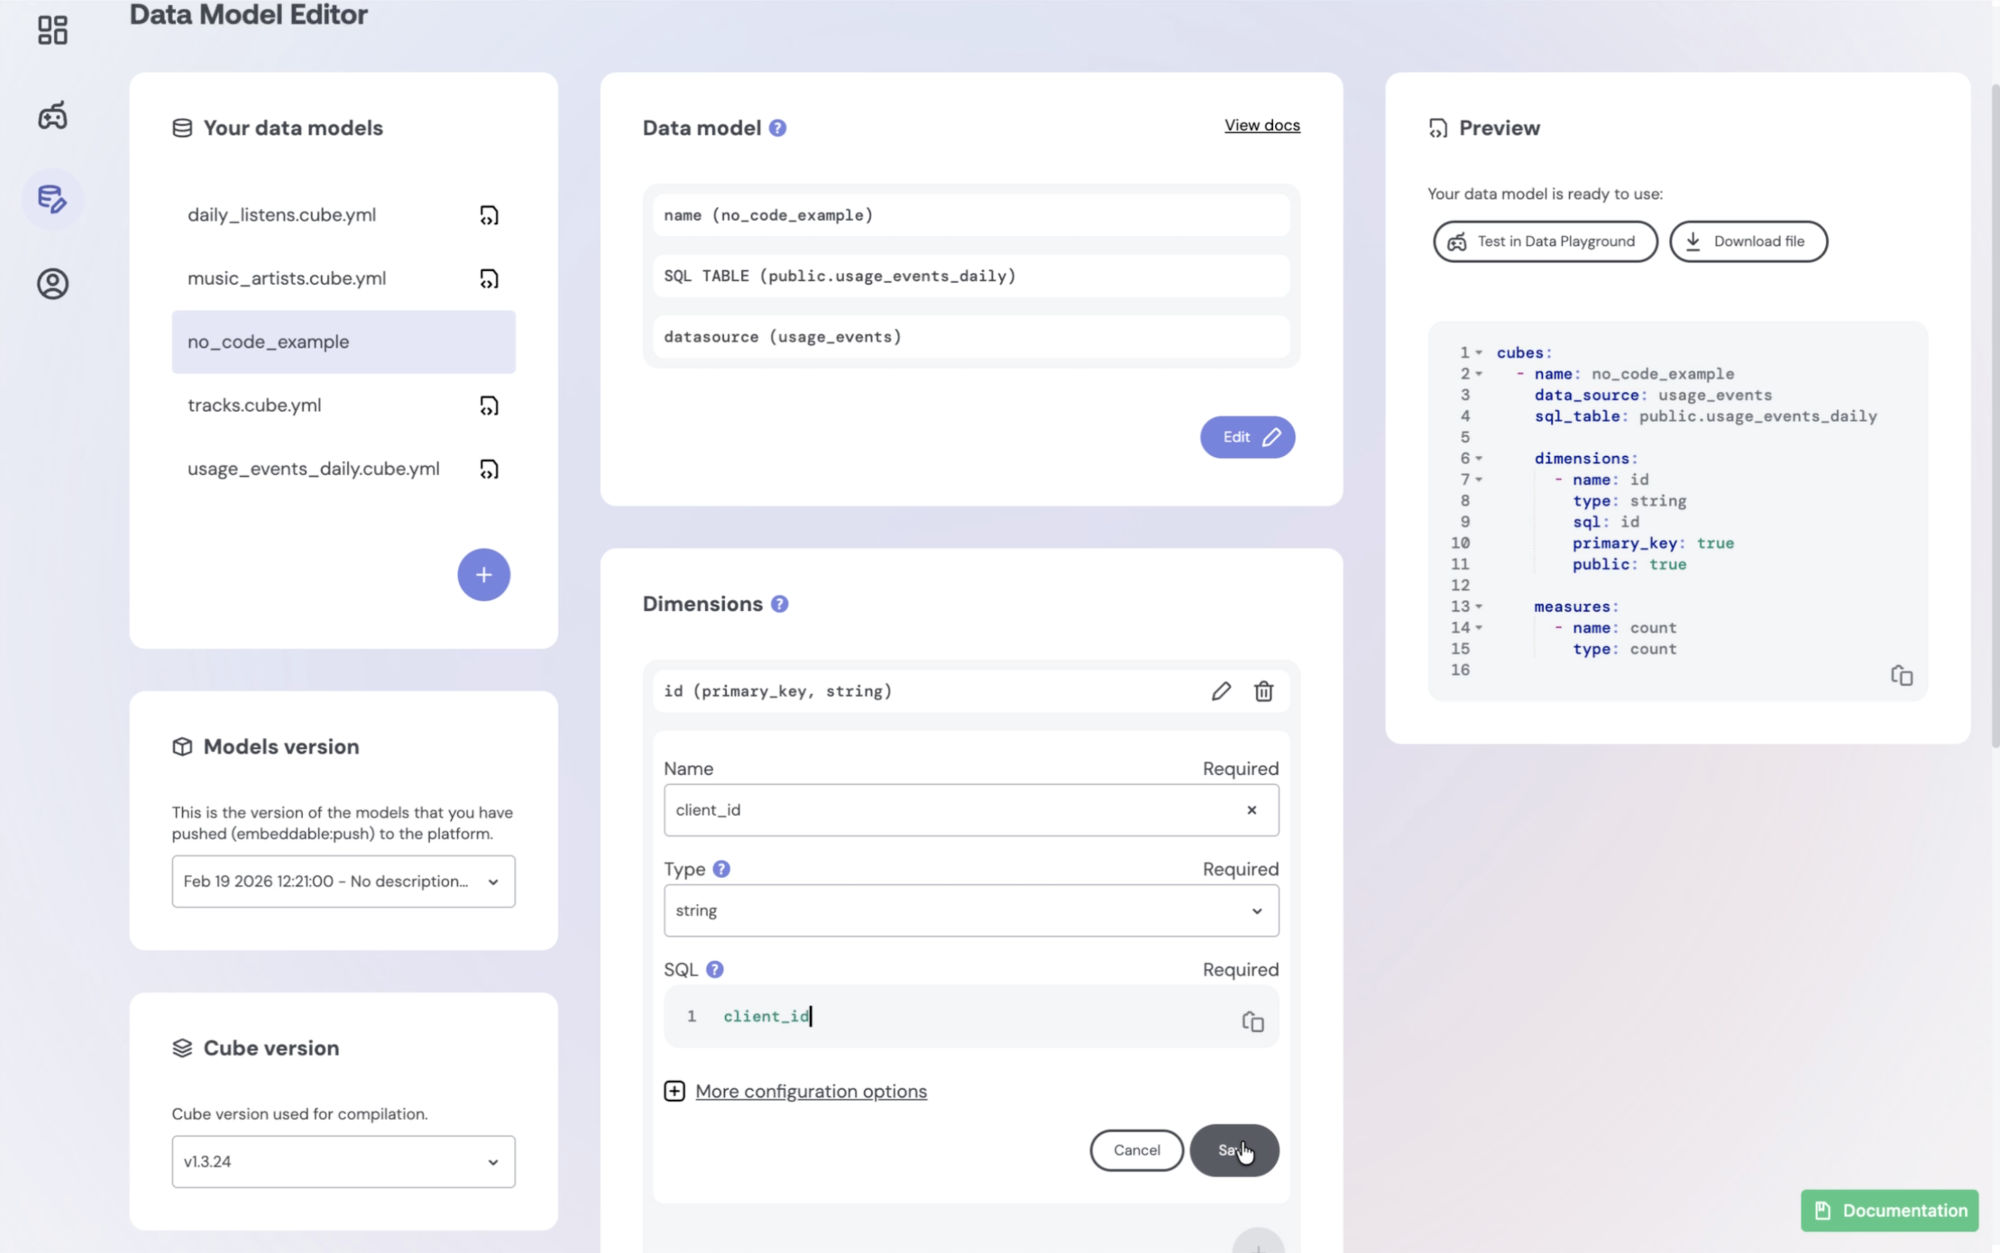
We recommend using no-code models for quick iteration and learning the ropes, then switching to in-code models once you’re more comfortable with the syntax. The reason for this is because in-code models allow for version control via GitHub or your provider of choice.
No-code models are not a dead-end, however. If you later create an in-code model in your repository with the same name and push it using the CLI, the in-code model will replace the no-code model automatically, and any datasets referencing that model will begin using the in-code model. This makes it easy to start quickly in the UI and then transition to full version-controlled models over time.
Step 6 - Apply Row-Level Security
Sometimes before using data in dashboards, we need to secure it, meaning each end user, client, or tenant has access to only their own data. This is where Row Level Security comes in.
We’re going to start by updating our model to be able to access specific values we want to pass in. Remember the client_id column? We’ll use it to ensure that users only see their own data. Instead of referencing the table directly using sql_table, we’ll update the model to use a sql property and apply the RLS filter directly in the query. Here’s the YAML:
cubes:
	- name:usage_events_daily
	  data_source:default
	  sql: >
      select *
      from public.usage_events_daily
      where client_id = '{COMPILE_CONTEXT.securityContext.client_id}'

	  dimensions:
	  ...
As you can see, we’re dynamically injecting the client_id from the security context. This ensures that every query generated by Embeddable is automatically filtered based on who is viewing the data. Here we’re using client_id as an example, but in your case, this could just as easily be a user_id, tenant_id, or any other identifier your use to control data access.
Once you’ve updated your model, you’ll want to be able to test and validate Row Level Security inside the Embeddable builder. We can do that by updating our security context presets, which live at src/embeddable.com/presets/security-contexts.sc.yml. Here are two example entries:
- name: Example Customer 1
  securityContext:
    client_id: 12
  environment: default

- name: Example Customer 2
  securityContext:
    client_id: 13
  environment: default
Each preset represents a different viewer with a different client_id. Note: this only impacts the Embeddable builder. It has no effect on your live dashboard whatsoever.
Once the model and the presets have both been updated, we push the changes to Embeddable using the same CLI workflow as before:
npm run embeddable:build
npm run embeddable:push
After this, the updated model and presets are available inside Embeddable. Now we can verify that the Row Level Security works in the Data Playground. You can do this by clicking the gamepad icon on the left side of your workspace. By switching between the different security context presets, we can clearly see that the data changes, confirming that Row Level Security is applied correctly.**
When embedding dashboards into your application, Row Level Security is enforced by passing the same security context when generating an access token using the Tokens API. We’ll look more into how to generate that token when we get to embedding our dashboard into our application.
Step 7 - Build a Dashboard
All right! We’ve got a connection to our database, a model with some dimensions and measures, and a workspace that’s all set up. Let’s make a dashboard! We’re going to keep this one simple - two KPIs, a bar chart, and a table. We actually recommend this approach when you’re getting started with Embeddable: get something working and out the door! Embeddable makes it very easy to iterate and publish changes, so there’s no reason not to publish your dashboard as soon as it’s displaying information your users will find valuable.
Obviously, your data is going to be different than ours. That’s part of why we’re keeping this simple and straightforward. You should be able to follow along with this tutorial assuming you’ve connected data that has an ID, at least three dimensions, and a measure. It will be helpful if one of those dimensions is some kind of date.
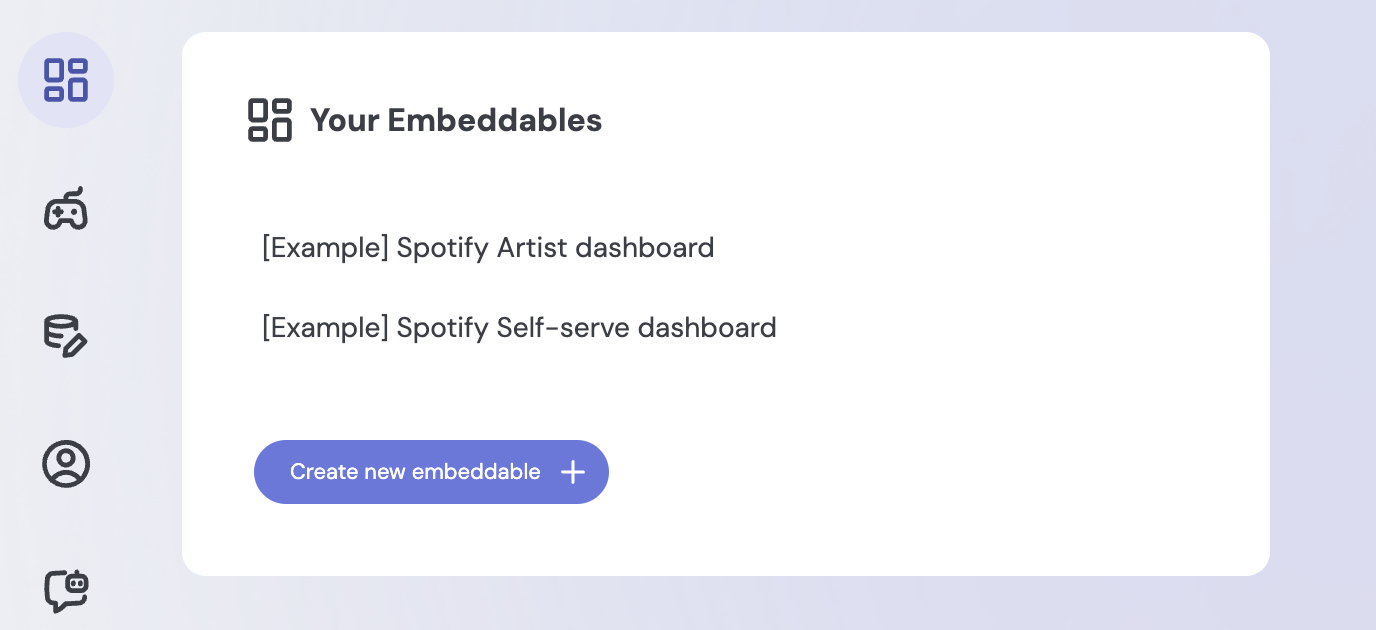
To get started, make sure you’ve clicked the top icon in the left menu of your workspace, which will show your dashboards. You should see the two sample dashboards, but let’s create a new one by clicking the Create New Embeddable button.
We recommend giving your dashboard a name right away so you don’t end up with a bunch of them named Embeddable 1, Embeddable 2, and so forth. Just click on the name after the Embeddable logo in the top menu. For this tutorial, let’s call ours “Initial Data Test”.
Datasets
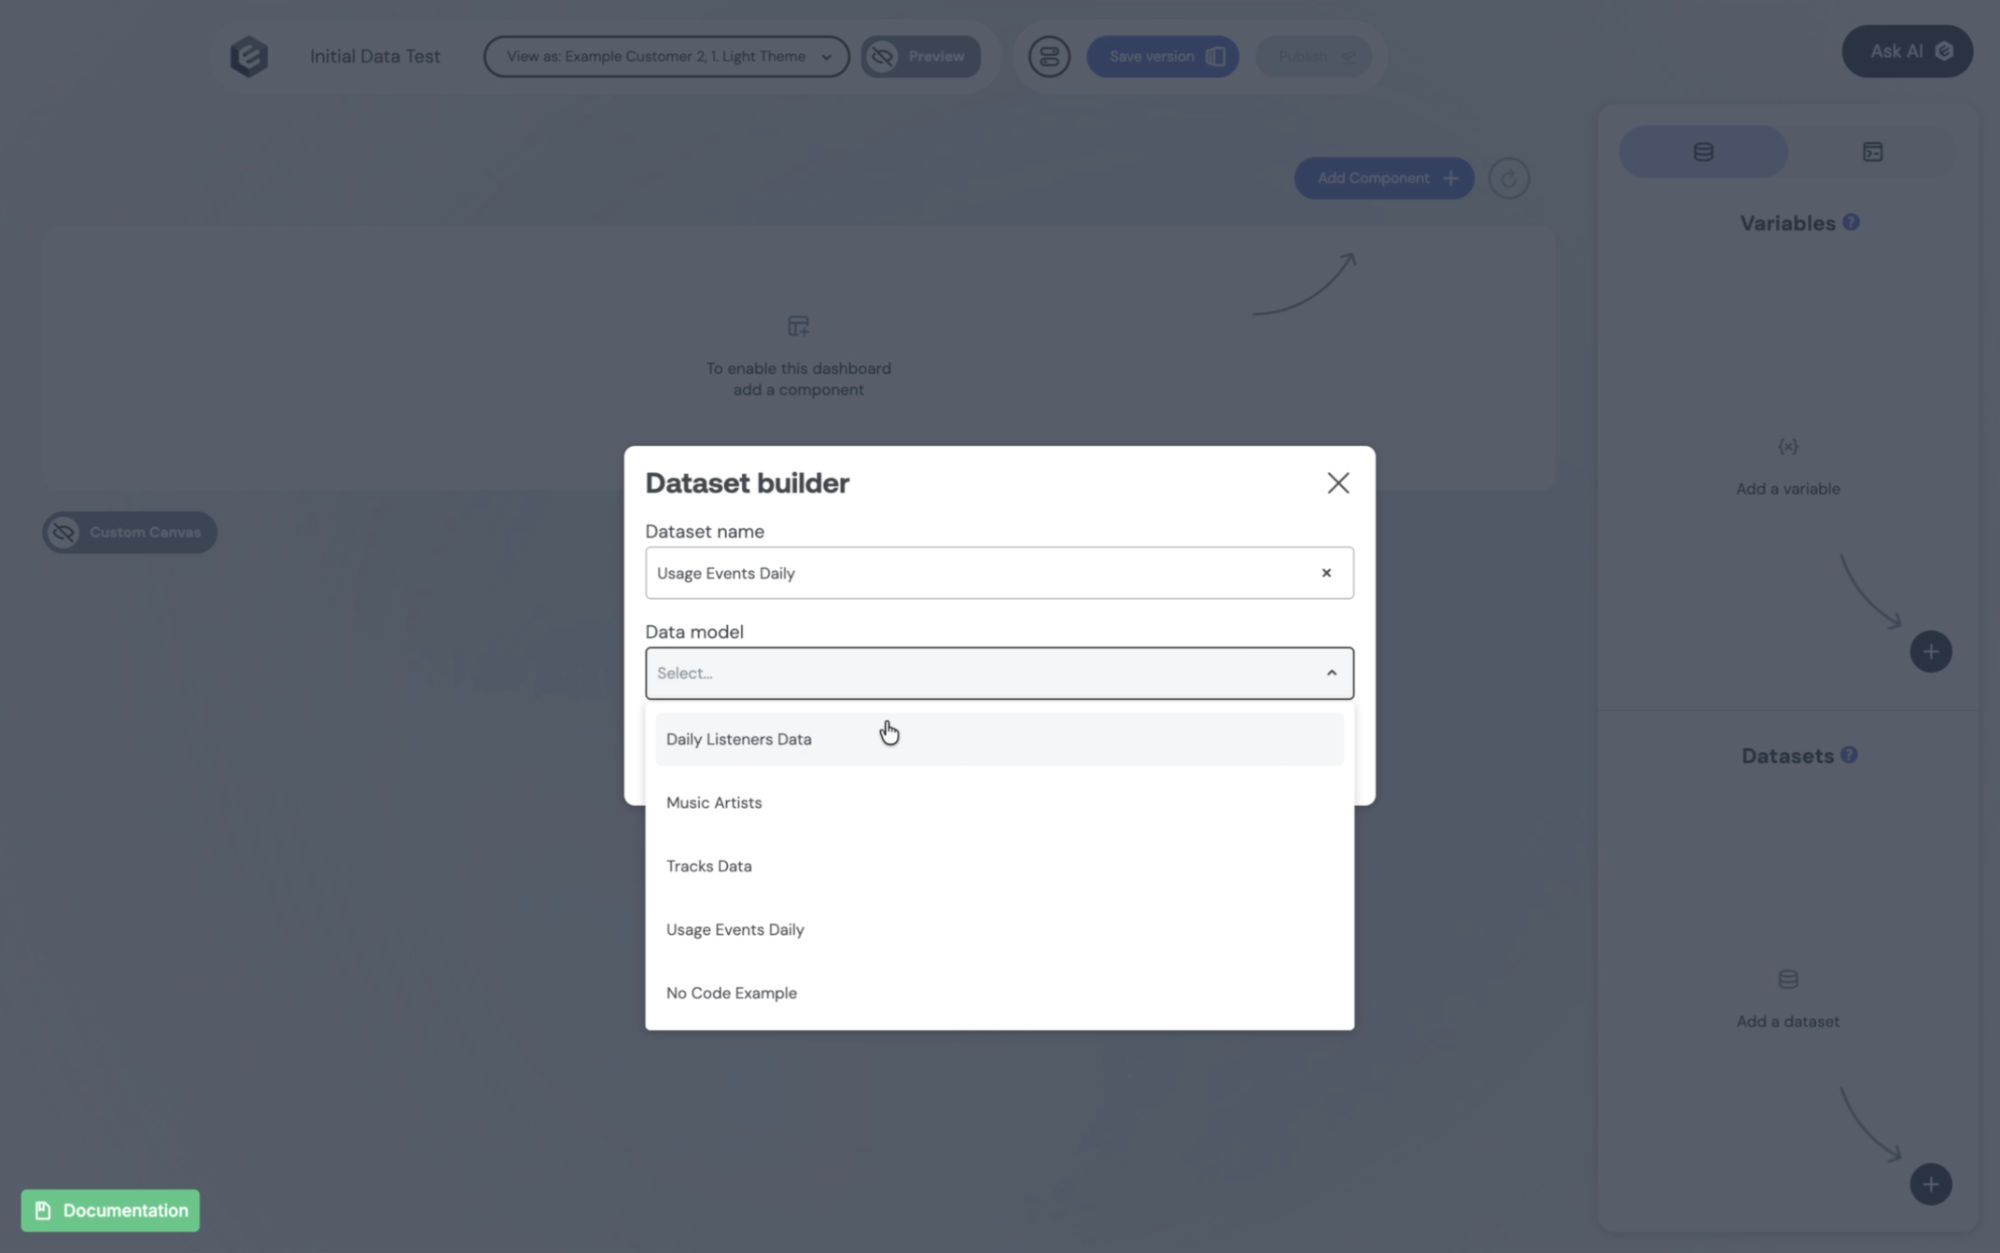
The first thing we want to do is create a dataset. We’ve got an entire video and tutorial (opens in a new tab) explaining those, but in brief, a dataset is an instance of your model. You can have multiple datasets in the same dashboard, and even have multiple datasets that reference the same model … which means you can filter one dataset differently than the other without having to change the underlying data model!
We’re going to name our dataset “Usage Events Daily” and choose the model we just added, the usage_events_daily model. In general it’s a good idea to use dataset names that are similar to the model names, such as “Orders” or “Orders - Only EU”, or similar. Save the dataset and you’ll see it appear in the right-hand console, ready for use. You can click it to explore more options, but for now we’re going to use it as-is.
Charts
Next up, we’ll click the Add Component button in the top right, next to the console. This will bring up a list of component previews. By default, Embeddable comes stocked with plenty of components from our Remarkable Pro library, but you can also build your own. That’s another tutorial, though! For now, let’s scroll down a bit and choose KPI Chart - Number.
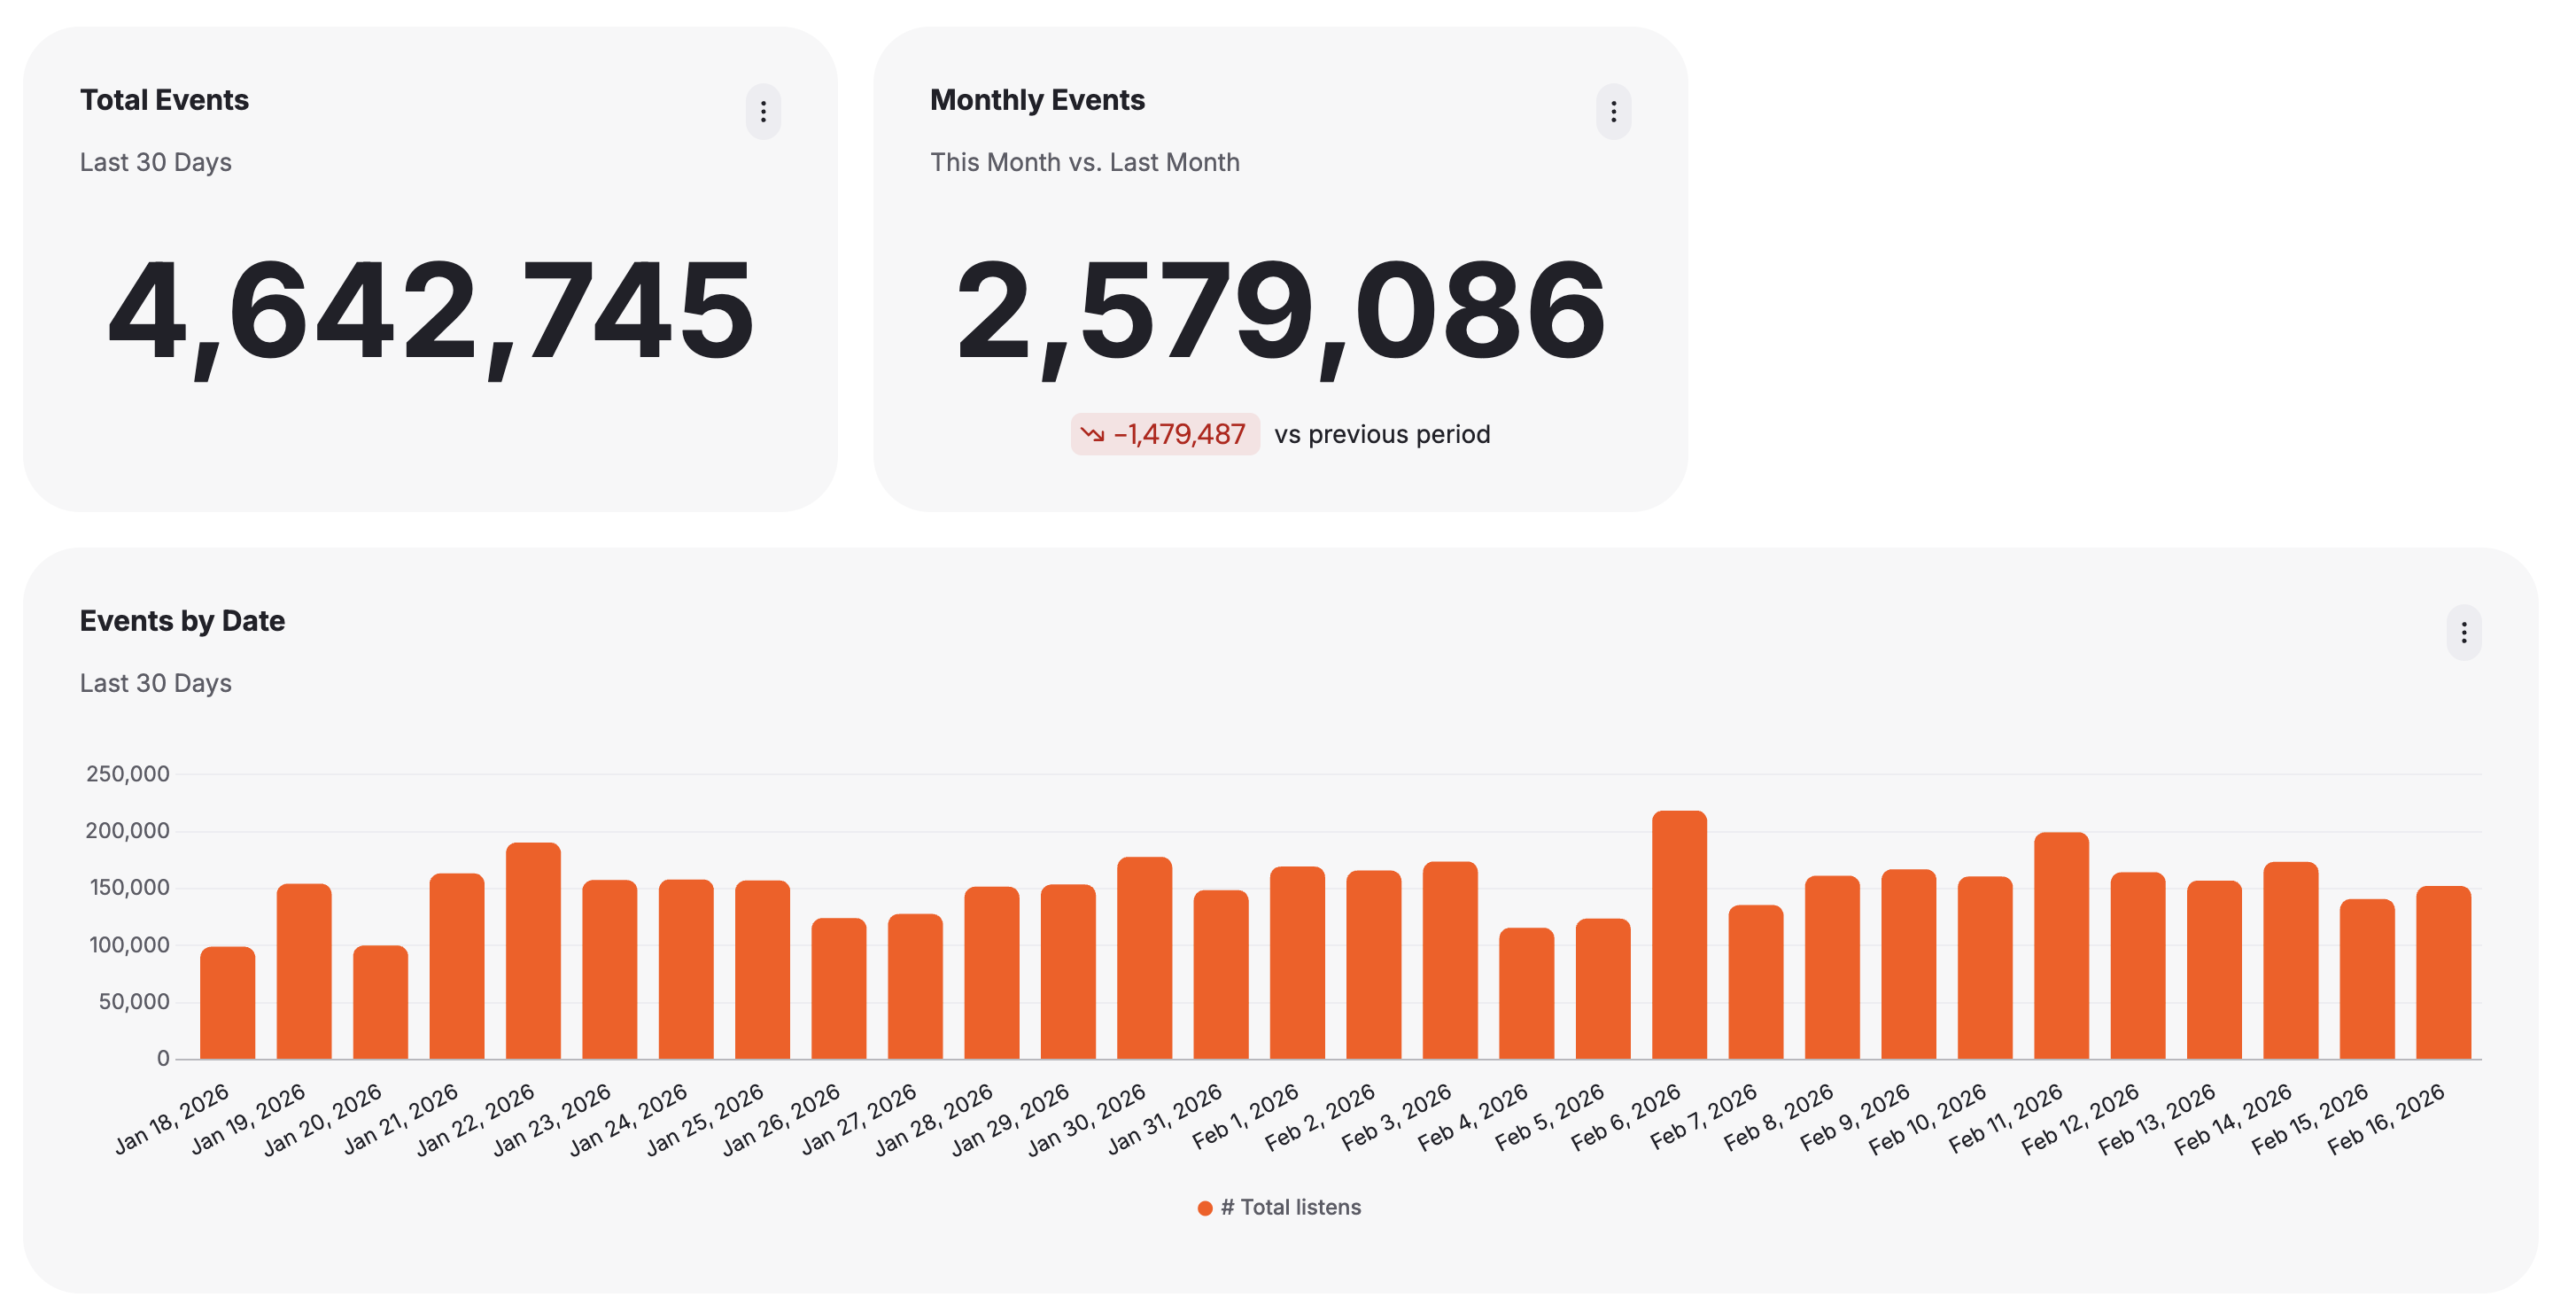
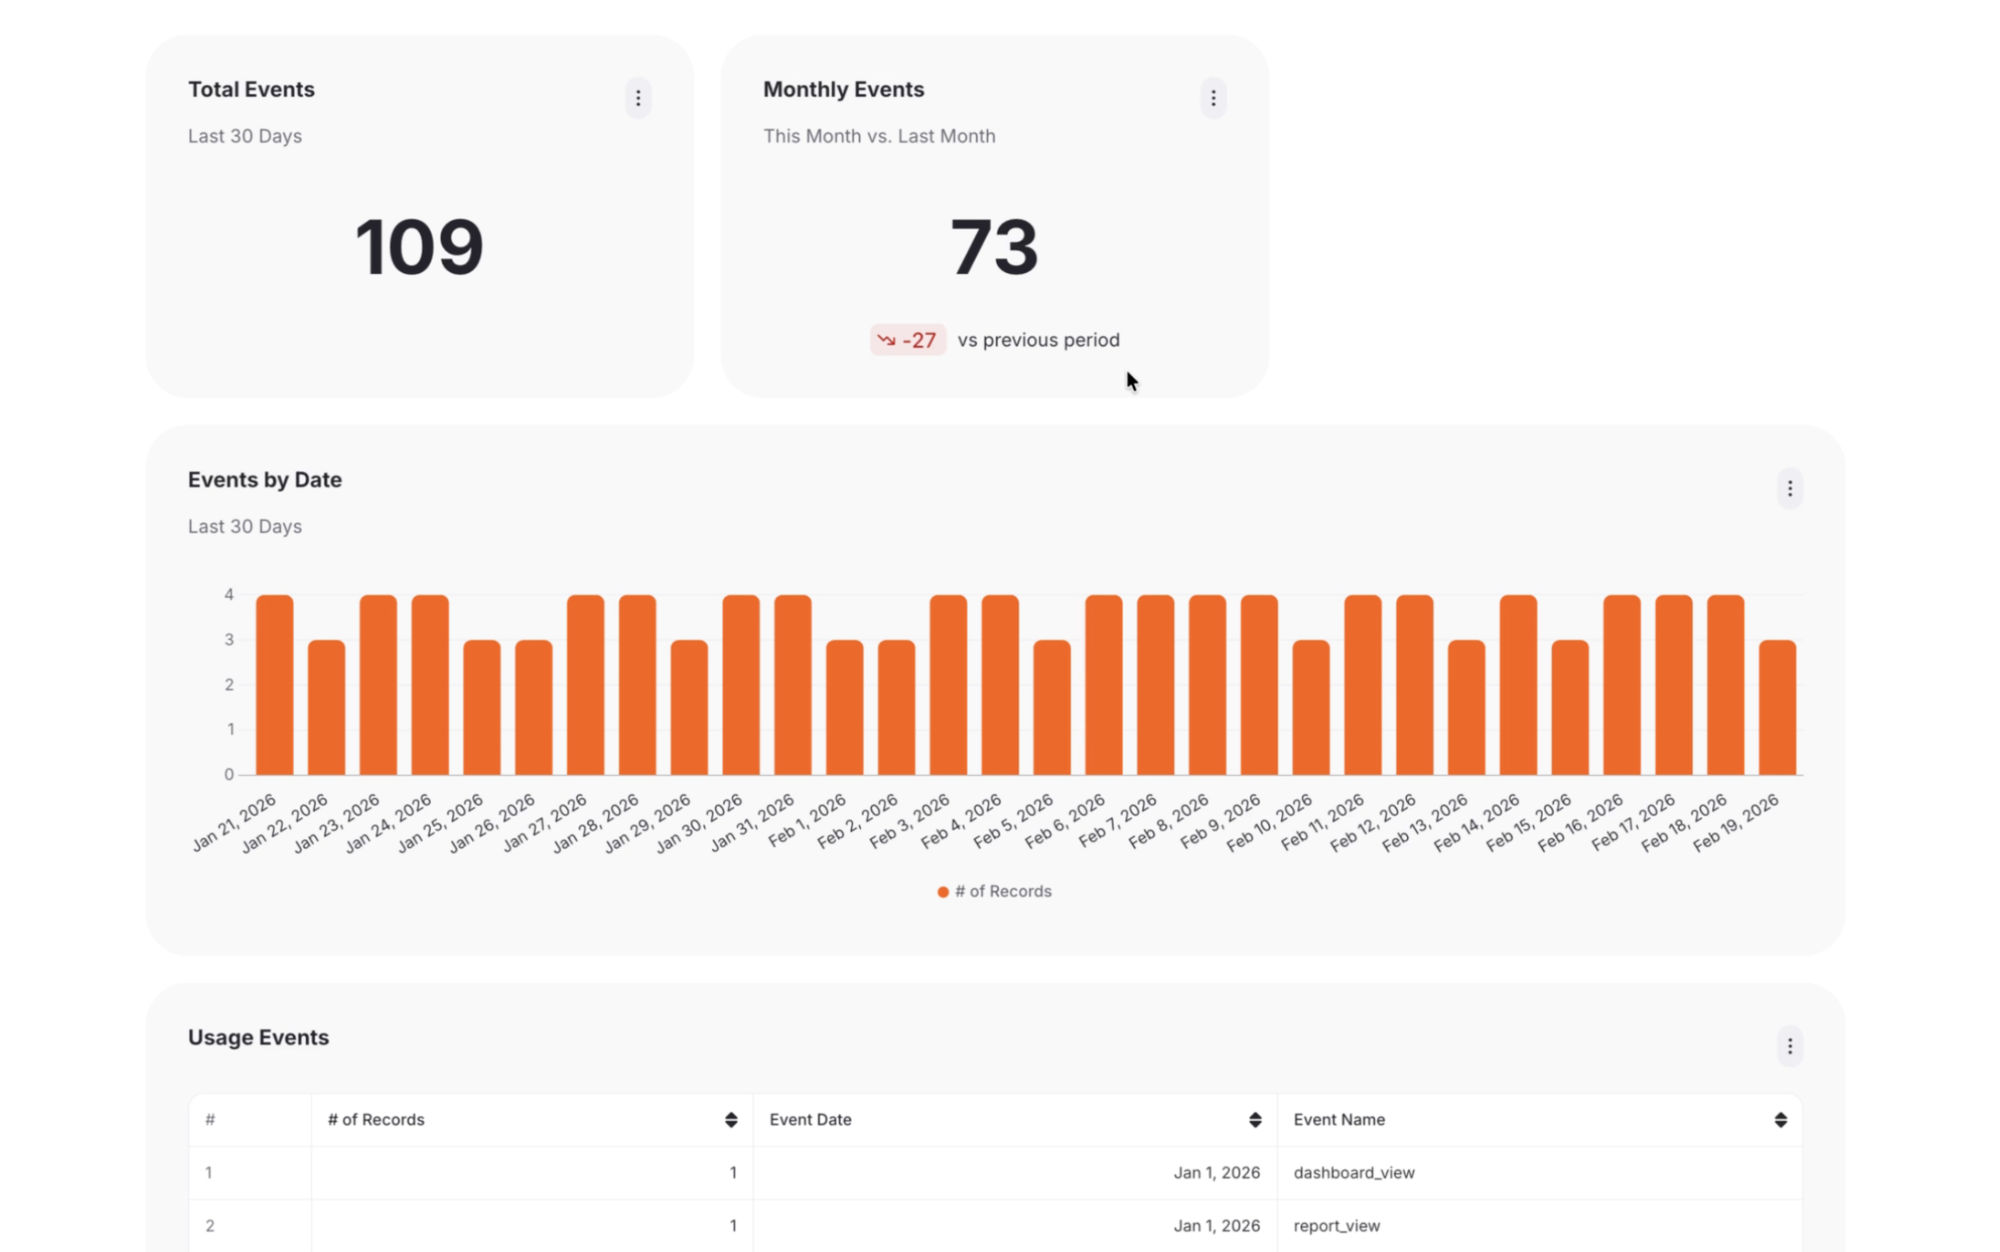
For the Dataset, well, it’s an easy choice - we’ve only created one! So we’ll choose “Usage Events Daily.” For our measure, we’re going to select # of records. We’ll add a title of “Total Events” and in the Description field we’ll add “Last 30 days”. We can leave the tooltip and the font size inputs blank.
But how can we be sure we’re only showing the last 30 days of data? Well, let’s add a filter. Click the “filter” button, choose event_date, choose “in date range”, and choose “Last 30 Days.” Once we’ve done that, we’re good to go, so we can click the Add to dashboard button. This will, unsurprisingly, add the component to our dashboard. You may notice that it’s rather large by default. Just click and drag at the bottom right corner of the component to resize it to something a little less aggressive.
Next we’ll click Add Component again, and this time we’ll choose KPI Chart - Comparison. We’ve only got one measure at the moment, count, so we’ll do our comparison against that, but this time we’ll do current month vs. previous month. Select the same dataset and the same measure. For the time property, choose event_date, and for the primary date range, choose “this month.” For the comparison period, choose “previous period” which will see that the primary date range is set to the current month and automatically choose the previous month. Note that “this month” will very often be much lower than “last month” because “this month” only counts the days of the current month, not the last thirty days. So the previous month has an entire month’s worth of data, but this month might only have a week.
For the title we’ll put “Monthly Events” and for the description we’ll put “This Month vs. Last Month”. We’ll leave the rest of the inputs at their default settings. Click Add to dashboard and we’ve got another component ready to go. Well, pending a resize.
Next let’s add our bar chart. Click Add Component again, and this time choose Bar Chart - Default. We’ll once again select our dataset, and then choose count again for the measure, and event_date for the dimension. Let’s again filter this component down to the last thirty days, so we’ll click the filter button, choose event_date, “in date range”, and “Last 30 days”. For the title, we’ll put “Events by Date” and for the Description we’ll put “Last 30 days.” The only other input we’re going to change on this chart is “show value labels” - I think the chart will be less busy without them.
Click Add to dashboard and let’s again drag this chart, this time to make it a little taller. All right! Now we’ve got something that’s starting to look pretty great. Let’s add a table of data underneath it.
Once more, click Add Component. This time, we’ll choose Table Chart - Paginated. Once again, we’ll pick our Usage Events Daily dataset. For the columns, we’ll choose everything except client_id, so the ID, event name, and event date. We’ll also choose the count. For the title we’ll put “Usage Events” and we’ll leave everything else as default. Note that this will only give us 1,000 results. Embeddable components can go up to 10,000 results by default, but in general that amount of data isn’t really useful to end users, so we recommend using filters and sorts to break things up and keep them bite sized.
For now, though, we’ll just display a thousand rows (broken up in to several pages). Click Add to dashboard and then give it some breathing room by expanding it vertically. You can see that the number of pages adjusts automatically depending on the number of rows the table size allows. Isn’t living in the future amazing?
Let’s take a quick look at how that security context file lets us apply row-level security to our data. As you can see, right now we’re on Example Customer 1, and we’re seeing a set of data. By choosing Example Customer 2 in the drop-down at the top of the builder, whether in editor or preview mode, we can see that all of the charts refresh and the data changes. That’s row-level security in action!
We don’t recommend trying to put every one of your clients into this file, unless you have only a handful. Instead, it’s best to find two to six clients whose data in combination provides a strong representation of what an end user might see when they visit your dashboards. This will allow your developers and data folks to test a variety of data situations and ensure everything’s behaving as expected.
We’ve got a dashboard that’s ready to go! Let’s get it into our application.
Step 8 - Embed Your Dashboard
To embed you dashboard, you’ll need to do two things. The first is add a call to our Tokens API somewhere in your back-end. The second is to add a few pieces of code to your client app that will allow your Embeddable to display. We’ll show you how to do both. For this demo, we’ll be using a simple React application I’ve set up, but Embeddable works just fine in Angular, Vue, or even plain HTML and JavaScript.
The first thing we’ll need to do is publish our Embeddable. Until we do that, no changes we’ve made in the builder are accessible to our end users. You need to do this step whenever you’re satisfied with your changes and ready to roll them out to your clients. First, click the “Save Version” button in the top menu. Then add version text and click “Save.” Once you’ve done that, you’ll see a “Publish” button appear at the bottom of the modal. We’re going to go ahead and publish to all three environments, development, staging, and production, as our application doesn’t differentiate between the three (you can learn more about these environments and how to use them in our documentation). Once we’ve published, we can check the publishing instructions to get information we’ll need, including our API key and Dashboard ID.
The next thing we need is a token. Let’s move over to a code editor. I’m going to do something in this video you absolutely should not do in your production application, which is use front-end code to get the token. The reason I’m doing this is so I don’t need to show you a full back-end API setup, but in your application, you need to generate the token on the back-end in order to keep your security contexts, API key, and other values secure. If you have any questions about this, please reach out to Customer Success. We’re happy to help explain it!
What we’ve got here is a very simple React application. We’re going to do almost everything we need in one file, but the first thing we need to do is incorporate Embeddable’s front-end scripts. To do that, we’ll open index.html and add a standard HTML script tag like this:
<script
      type="module"
      src="https://embed.embeddable.com/js/v1/?region=eu"
    ></script>
The region does matter here, so please make sure you use eu or us accordingly. We’ll save this file, and then we’ll head over to app.tsx. There’s a bunch of things happening here but we’ll go through them in order. First we define a few constants we’ll need:
const API_URI = 'https://api.eu.embeddable.com';
const API_KEY = 'redacted';
const EMBEDDABLE_ID = 'redacted';
const USER_KEY = 'redacted';
Then we’re creating a getToken function that gets the token. Again, this should live on your back-end in a production application, and your front-end app should reach out to your API to generate this token.
/* NOTE: This is bad security practice - do not expose API keys in frontend code */
/* We do this here for simplicity of the example */
const getToken = async () => {
  const response = await fetch(`${API_URI}/api/v1/security-token`, {
    method: 'POST',
    headers: {
      'Content-Type': 'application/json',
      Accept: 'application/json',
      Authorization: `Bearer ${API_KEY}` /* keep your API Key secure */,
    },
    body: JSON.stringify({
      embeddableId: EMBEDDABLE_ID /* the dashboard to load */,
      expiryInSeconds: 60 * 60 * 24 * 7 /* token expiry */,
      securityContext: {
        client_id: 12,
      },
      user: USER_KEY, // unique key representing current user
      savedVersion: 'v1',
    }),
  });

  const json = await response.json();
  if (!response.ok) {
    console.error('Error fetching security token:', json);
    return '';
  }
  return json.token;
};
Note that we’re sending security context, here, specifically a client_id of 12. This security context is passed in and stored in an encrypted format when generating the token, and will be used by Embeddable to populate the variables in the model, as we talked about earlier. We’ll change this value in a bit and see how it affects the dashboards.
Because React re-renders when values change, we want to create a wrapper for the <em-beddable /> element we need to add into the HTML code, rather than putting it directly into the JSX. This also allows us to forward the reference to the element, exposing its DOM node. This is basically just making sure that the web component works well with React. Here’s the custom element:
// Create a wrapper component for the embeddable custom element
const Embeddable = React.forwardRef(
  (
    { token }: { token: string; },
    ref: React.Ref<any>,
  ) => {
    // Return a custom element
    return React.createElement('em-beddable', {
      token,
      ref,
    });
  },
);
Finally, we have the main App component, which fetches the token and renders a loading screen or our Embeddable, depending on the token’s status. It looks like this:
// Main app component
function App() {
  const [token, setToken] = useState<string>('');
  const ref = React.useRef<any>(null);

  // Fetch the security token on component mount
  useEffect(() => {
    const fetchToken = async () => {
      const fetchedToken = await getToken();
      if (fetchedToken) {
        setToken(fetchedToken);
      }
    };

    fetchToken();
  }, []);

  // Show loading state while fetching token
  if (!token) {
    return <div>Loading...</div>;
  }

  // Render the embeddable component once the token is available
  return (
    <>
      <Embeddable token={token} ref={ref} />
    </>
  );
}
I’m going to add my details into the constants at the top off screen, save the file, and run my React app. We’ll open it up in a browser, and well, there you go. It’s our Embeddable, embedded in a client application and doing its thing!
Let’s switch back to our code for moment, to show again how Row Level Security works. Change the client_id value of 12 to 13 and save the file. Our React application should’ve hot-reloaded, so let’s go take a look. As you can see, we have new values in our charts. This is because we’ve changed which client’s data we’re looking at!
There’s so much more we could go into, but we don’t want to overwhelm you, so let’s wrap up here. We invite you to explore our documentation (opens in a new tab) and join our Community Slack (opens in a new tab). Thanks for checking out Embeddable, and we hope this has helped you get started. See you next time!