The end-user experience
Here’s what Custom Canvas looks like for your end-users — from a blank canvas to a multi-chart dashboard that’s theirs.
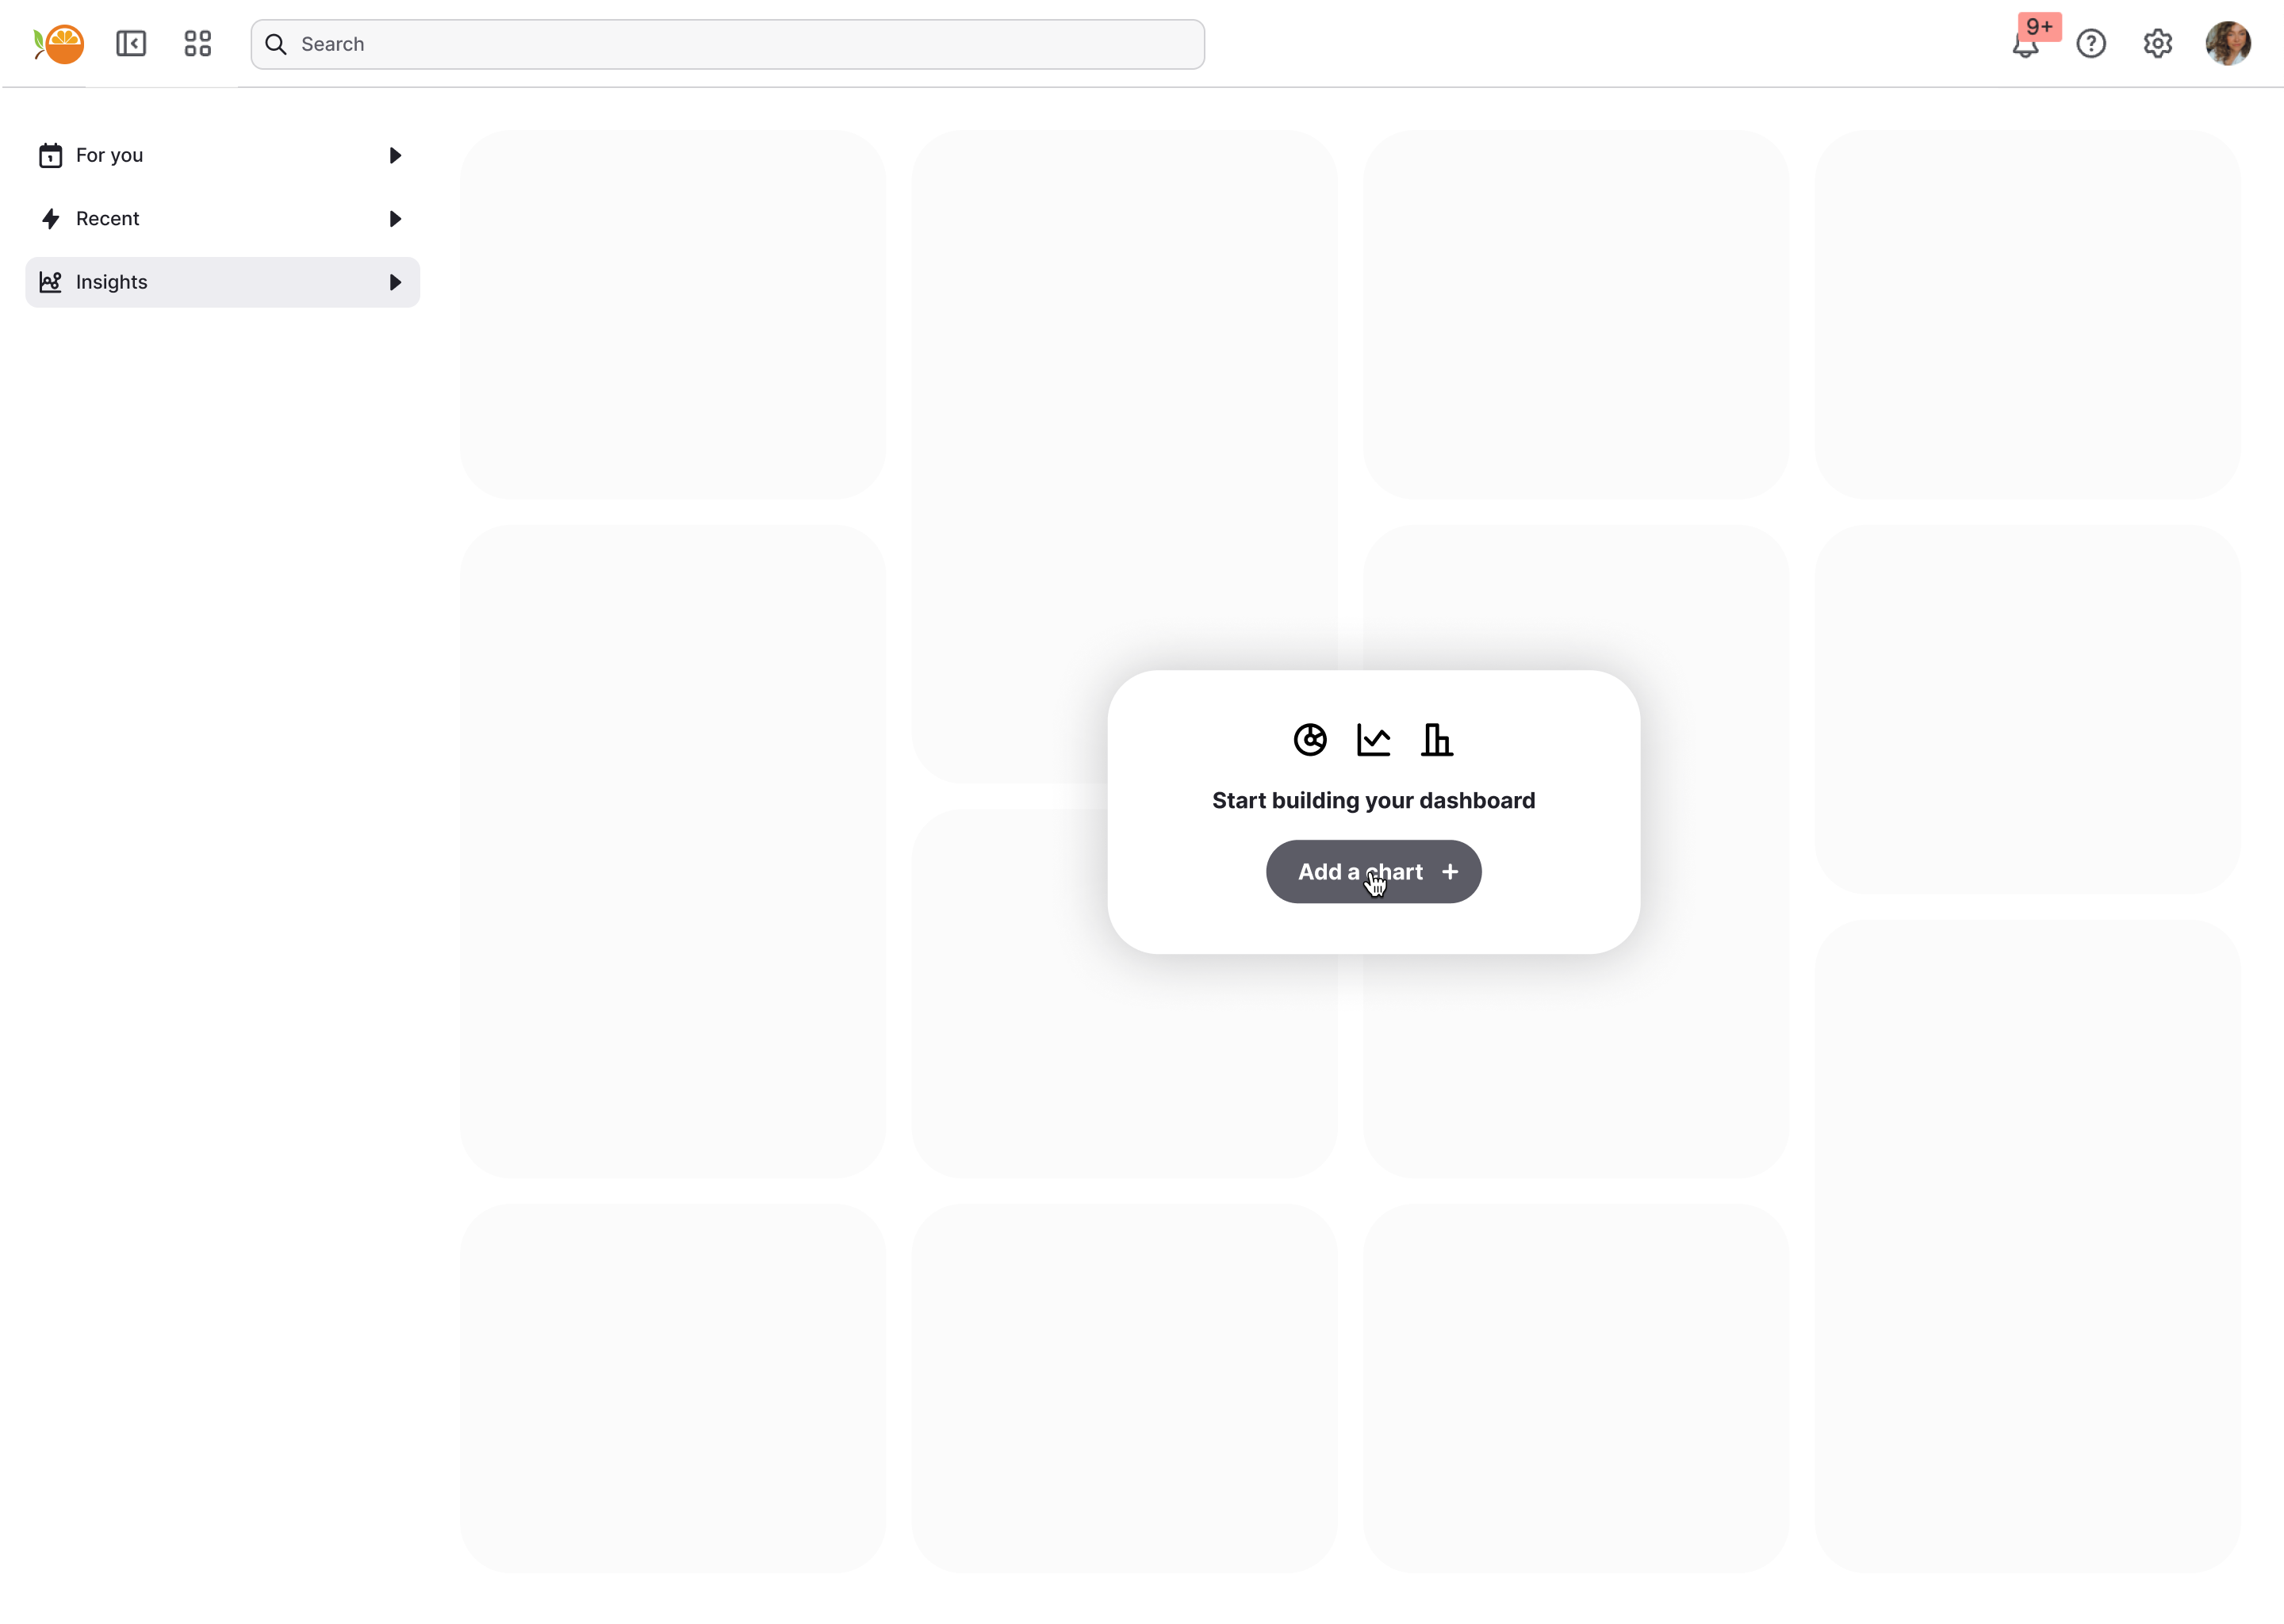
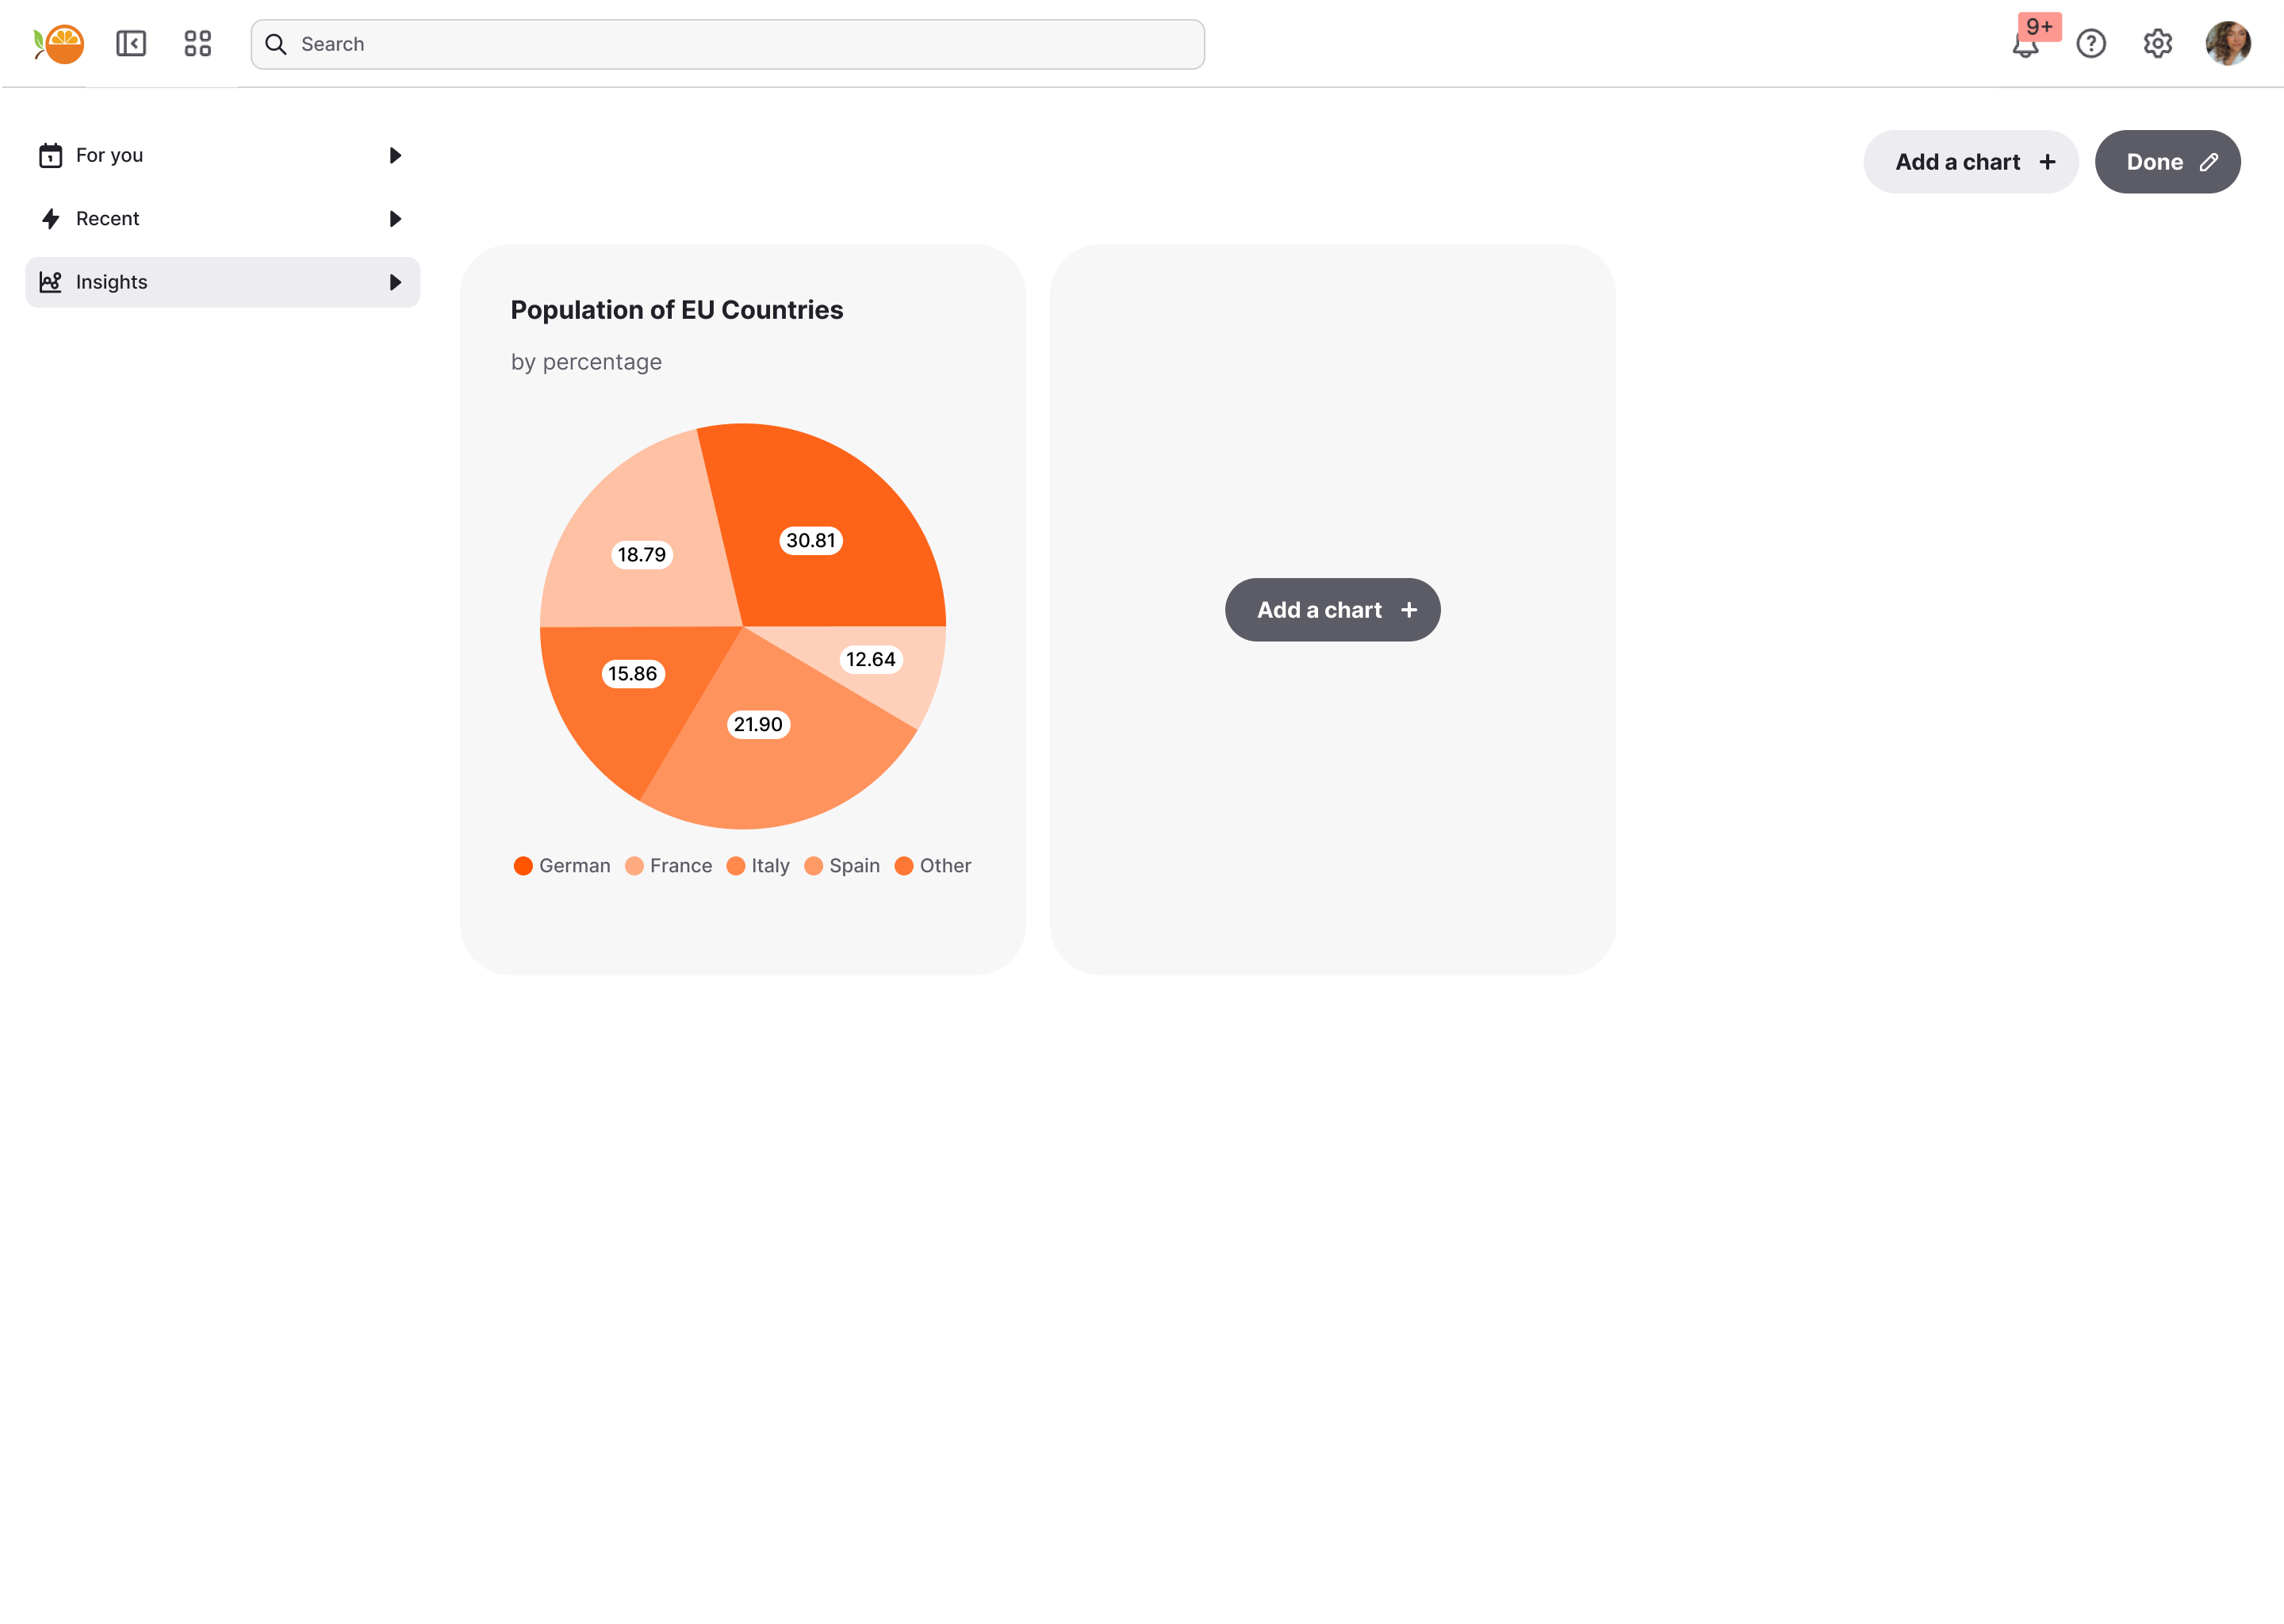
Start with a blank canvas or a Starter Canvas
Your users begin with a clean, empty workspace that feels flexible and approachable. From here, they can create dashboards that reflect their unique priorities.
Alternately, if you've set up a Starter Canvas, end-users begin with a pre-built dashboard they can explore and customize right away, rather than starting from a blank canvas.
How the Starter Canvas behaves:
- End-users opening a new canvas for the first time always see the Starter Canvas layout.
- If they haven't yet made any changes, they'll automatically see any updates you make to the Starter Canvas in the builder.
- Once they make any change of their own, their canvas is saved independently - further updates to the Starter Canvas won't affect them.
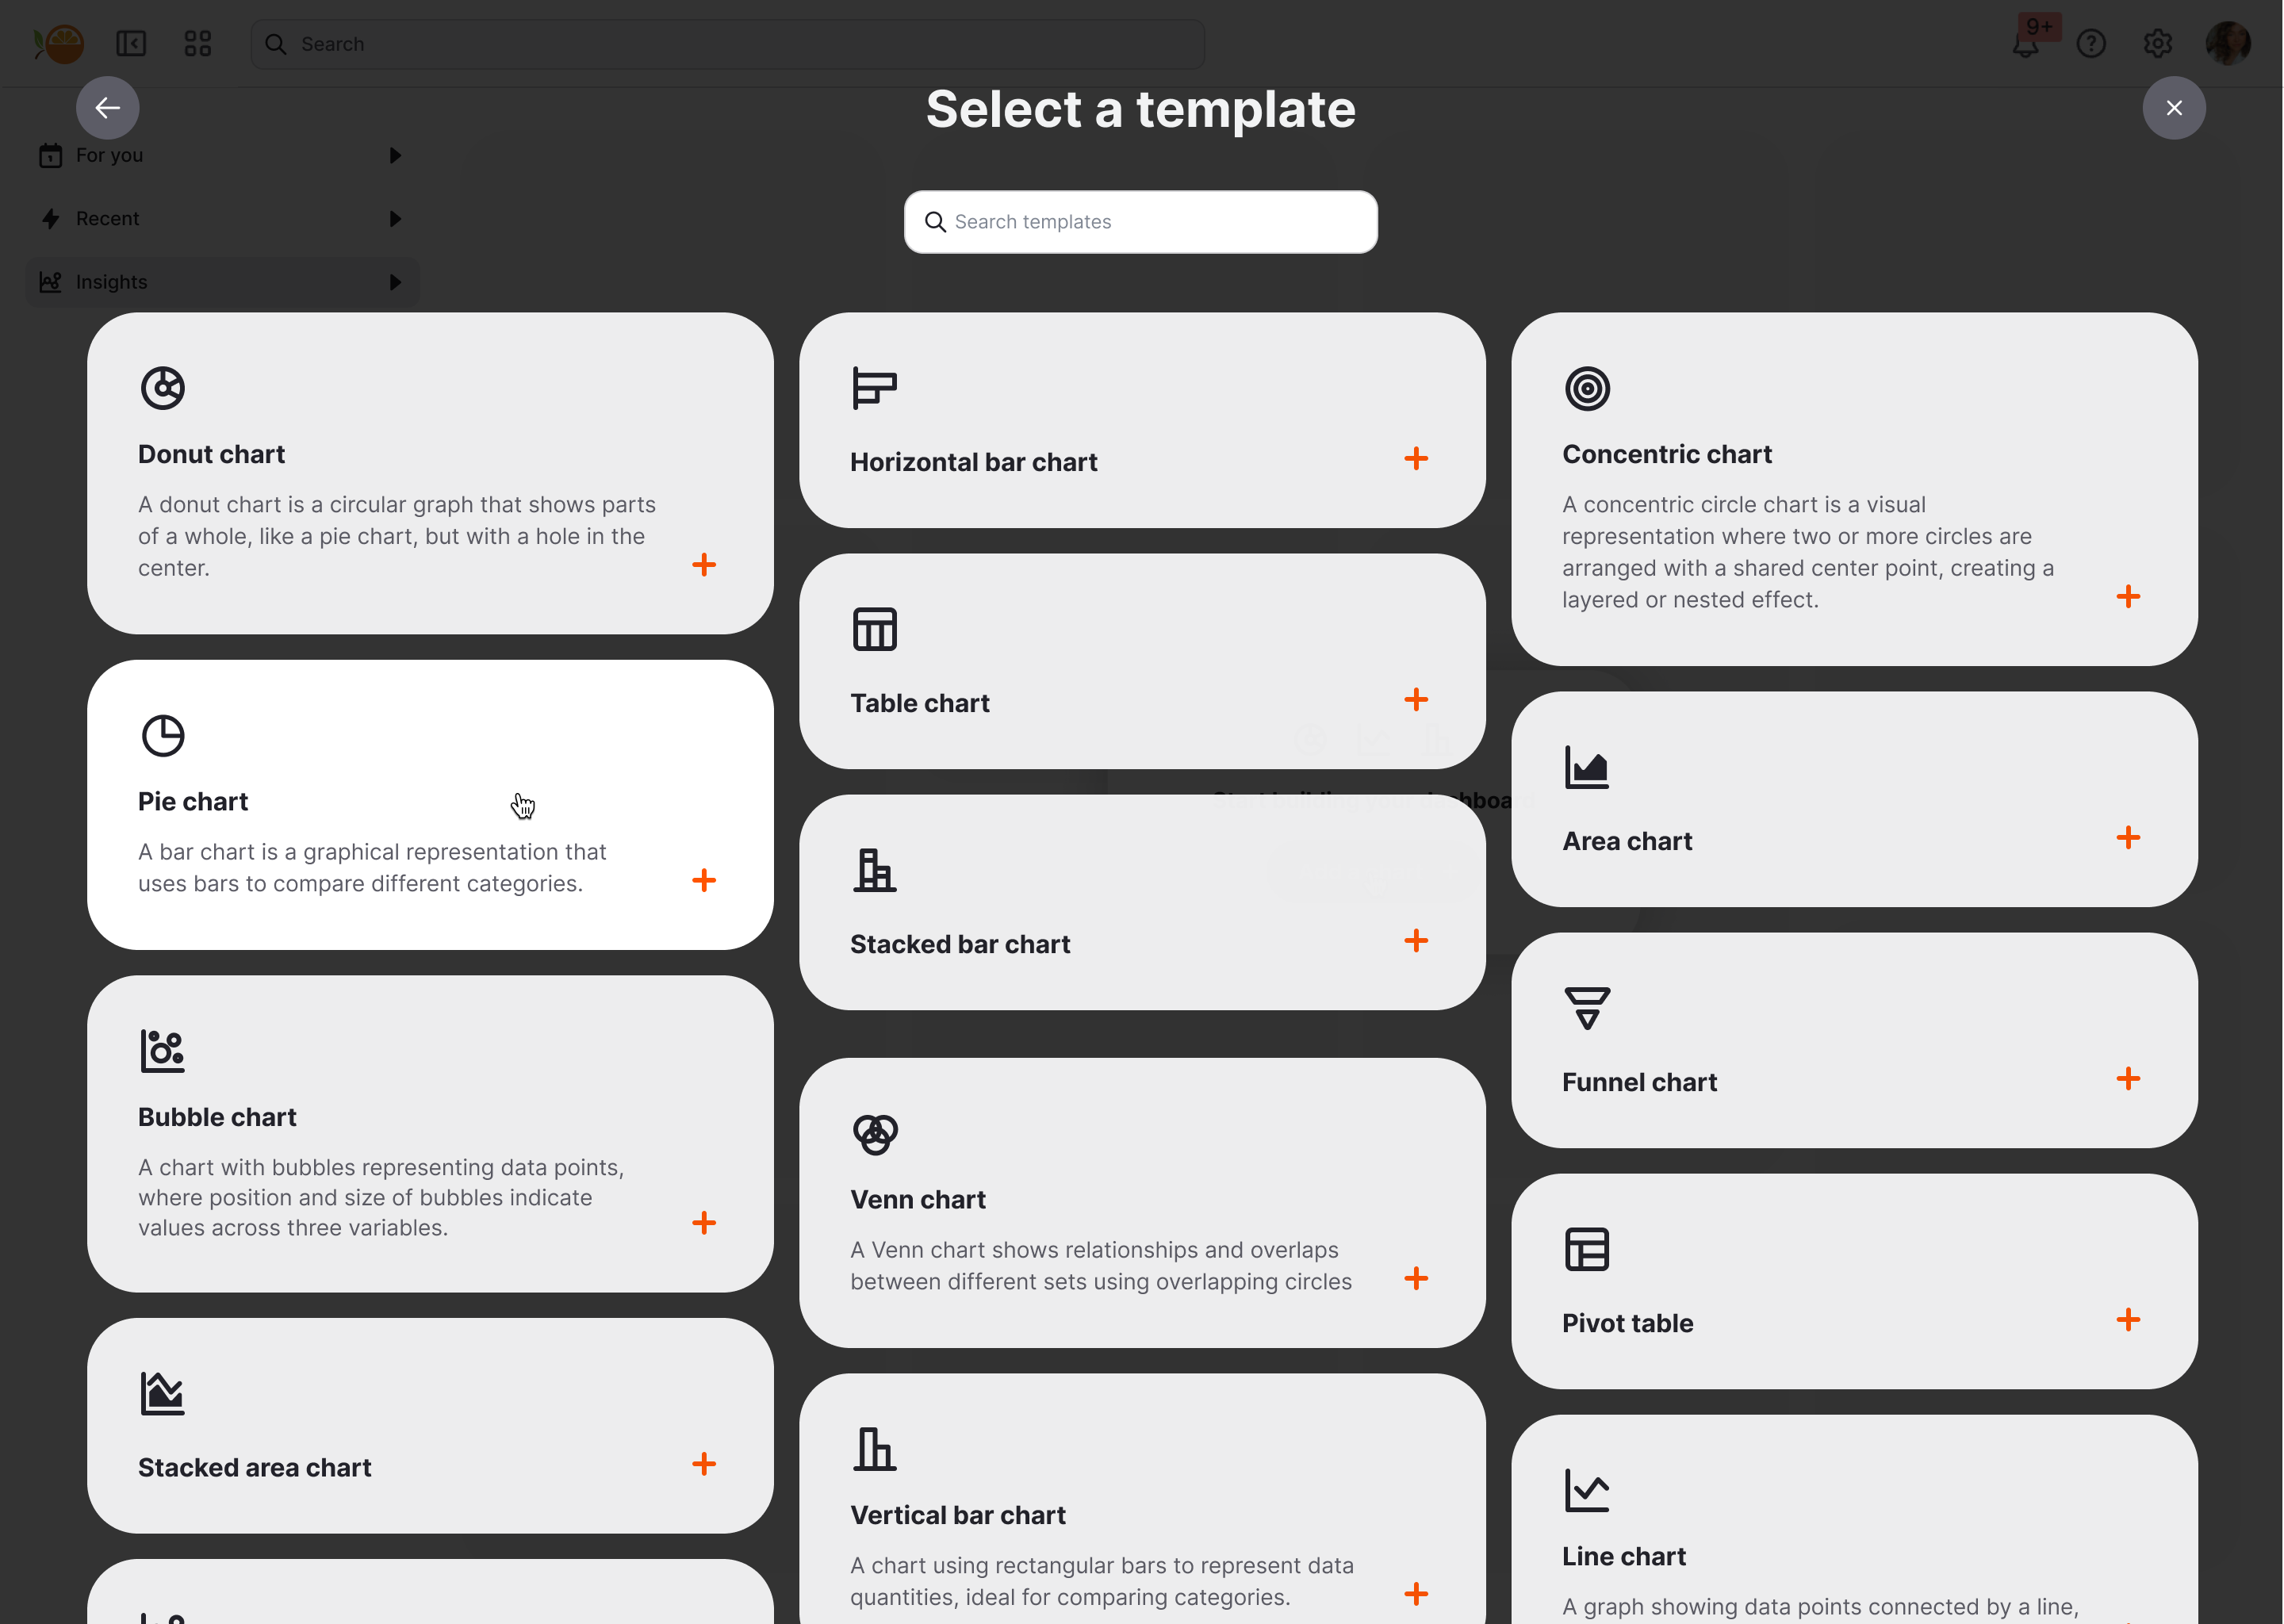
Use pre-built templates
You can provide a library of pre-configured dashboard templates tailored to common use cases. Users simply select one and begin customizing immediately.
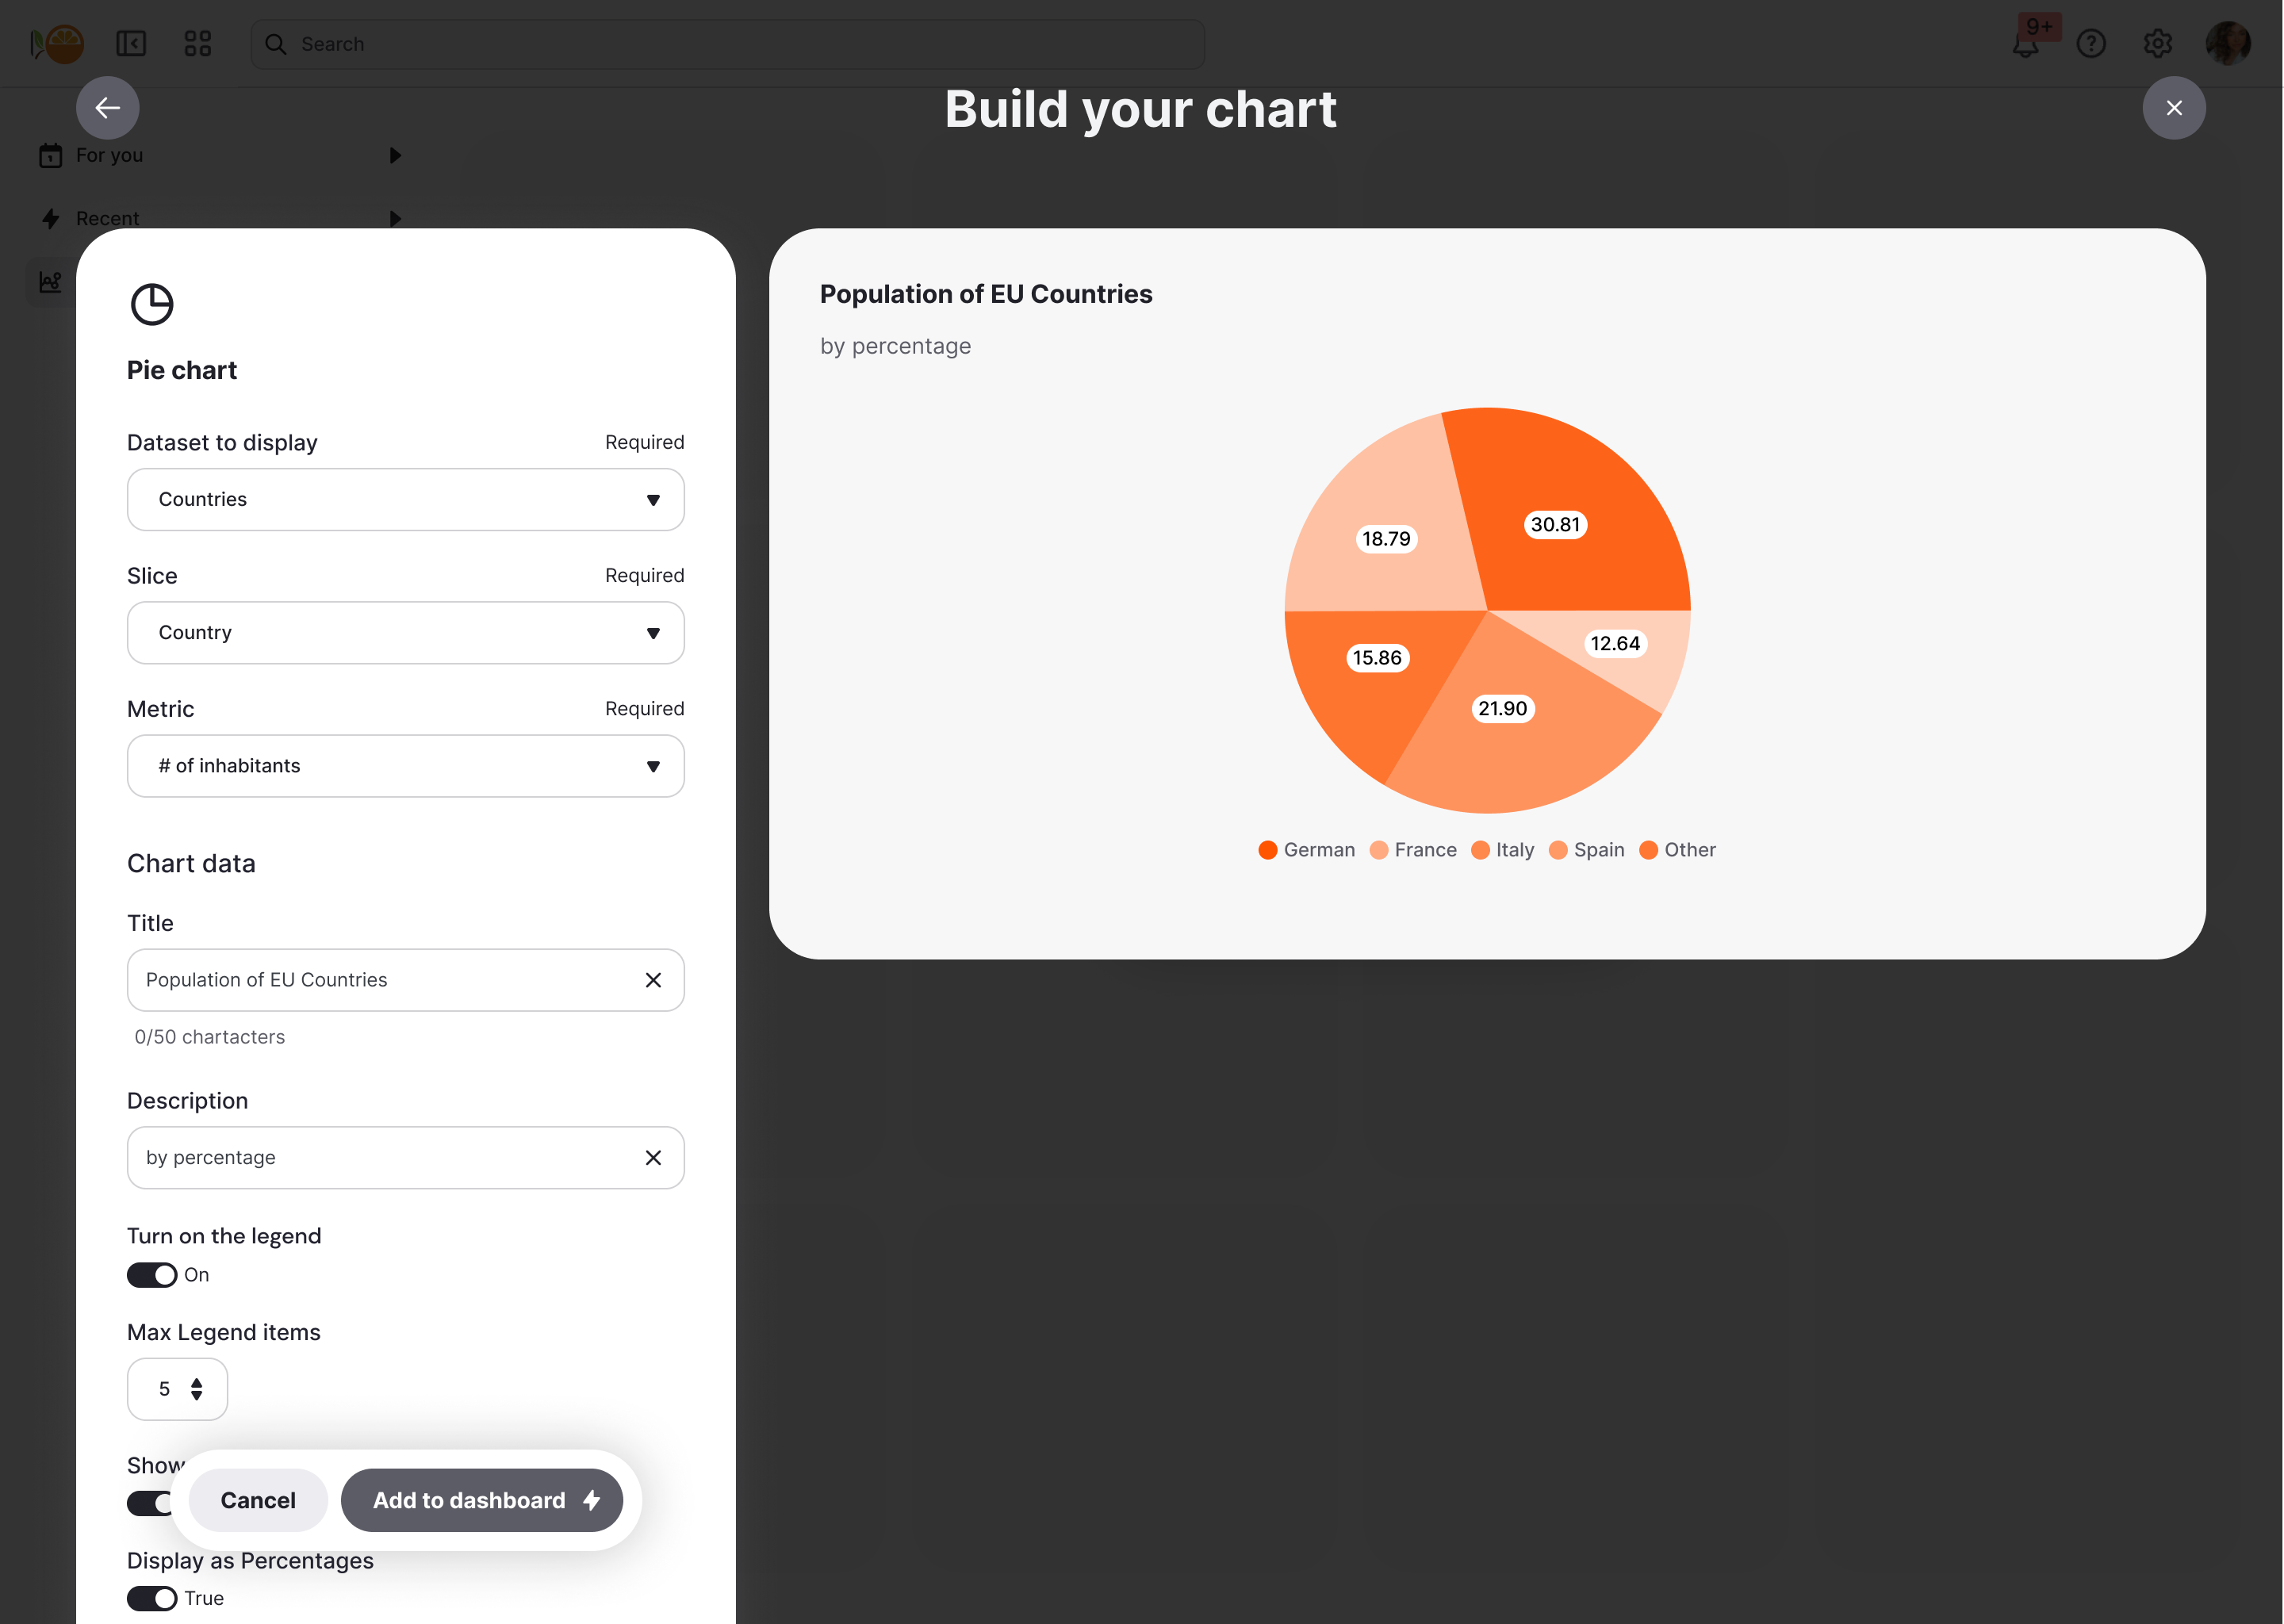
Build charts with guided inputs
Each chart is powered by the data fields you choose to make available. Users select measures or dimensions, and a live preview updates once the required inputs are complete. This strikes a balance between flexibility for them and control for you.
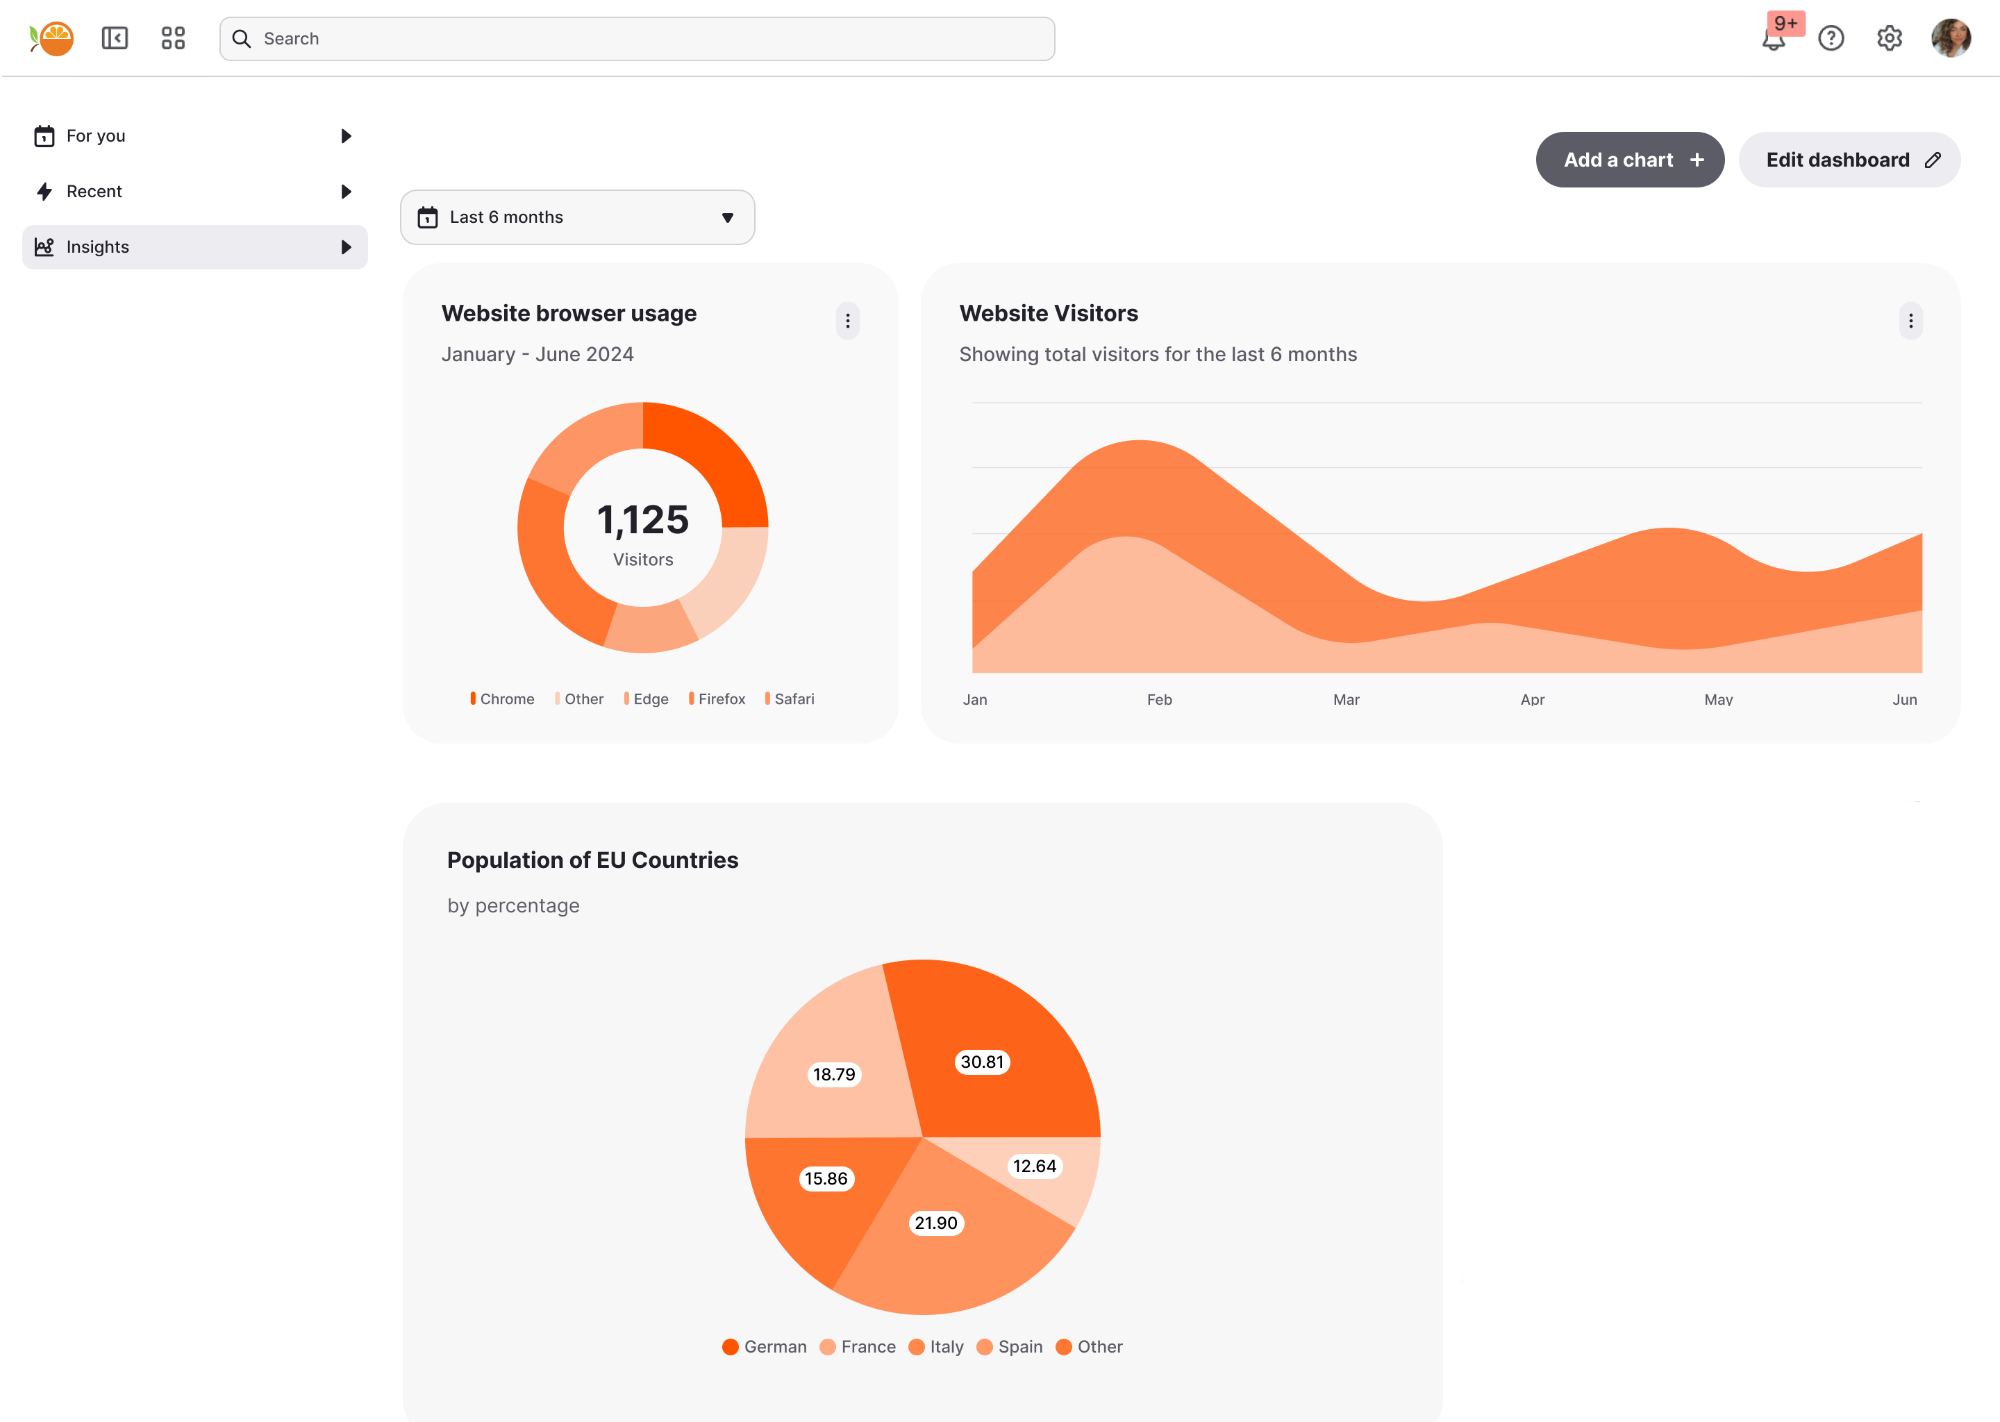
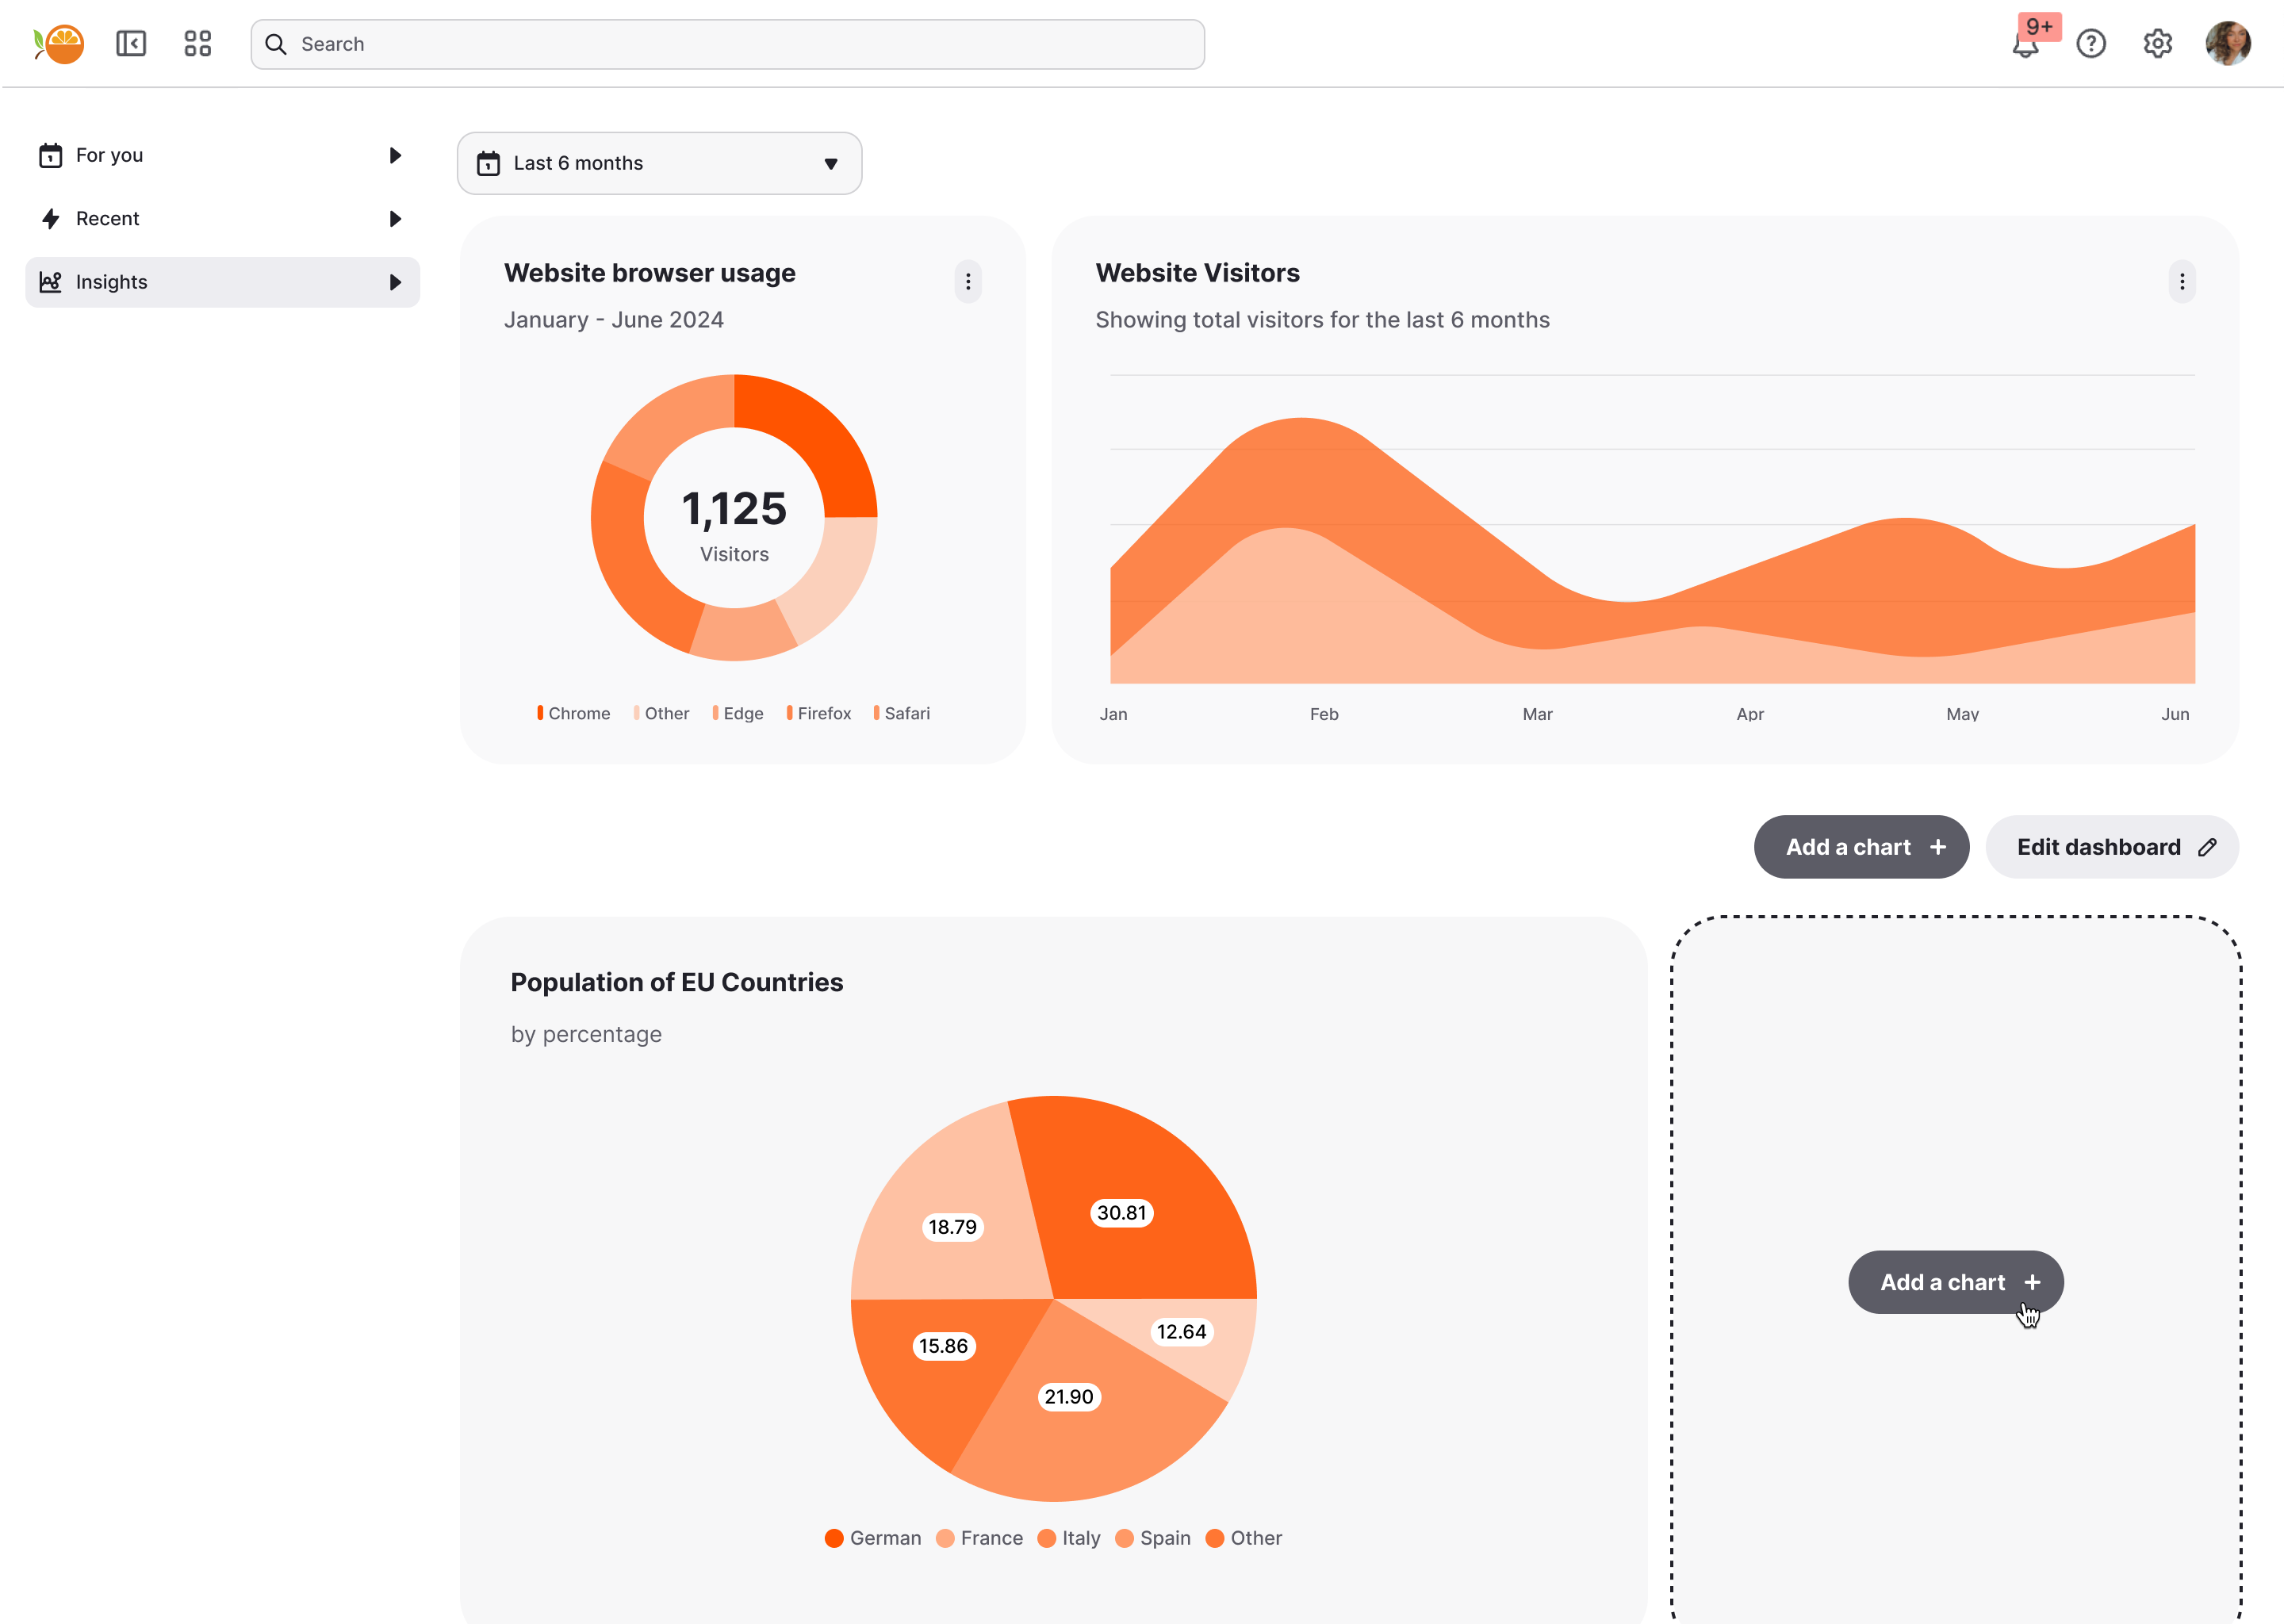
Create multi-chart dashboards
Users can add, arrange, and resize as many charts as they need that tell the story of their data.
Combine Custom Canvas and fixed content
Sometimes you want to set context. Custom Canvas supports hybrid dashboards, where you can fix key charts, metrics, or explanatory text at the top—while still allowing users to build their own canvas beneath.
Next: see how you build it.